






Source: ChainCatcher
With the U.S. midterm elections now settled, Wall Street's major trading desks are collectively signaling clients to buy.
Democrats won control of both chambers of Congress, and Trump said he accepts the election results. The dissipation of uncertainty triggered a sharp market rally. The S&P 500 rose nearly 2% in a single day, the Dow Jones gained more than 3%, and the VIX fear index posted its biggest one-day drop since April 2025. Tech and communication services led the advance, oil prices plunged more than 8%, and consumer sectors also performed strongly.
Against this backdrop, JPMorgan, Nomura, HSBC, Citadel Securities and other institutions have successively issued bullish reports, with a highly consistent core thesis: institutional positioning had already been sharply reduced before the election, short positions were near five-year highs, and combined with seasonal patterns and the reopening of corporate buyback windows, this has created favorable conditions for a rally through year-end.
Fidelity believes a key change brought by the midterm results is that the U.S. government will enter a divided governance state: Democrats control Congress while Republicans retain the White House. This political configuration may limit the scope for advancing government policies and reduce some policy uncertainty—and markets typically welcome such checks and balances.
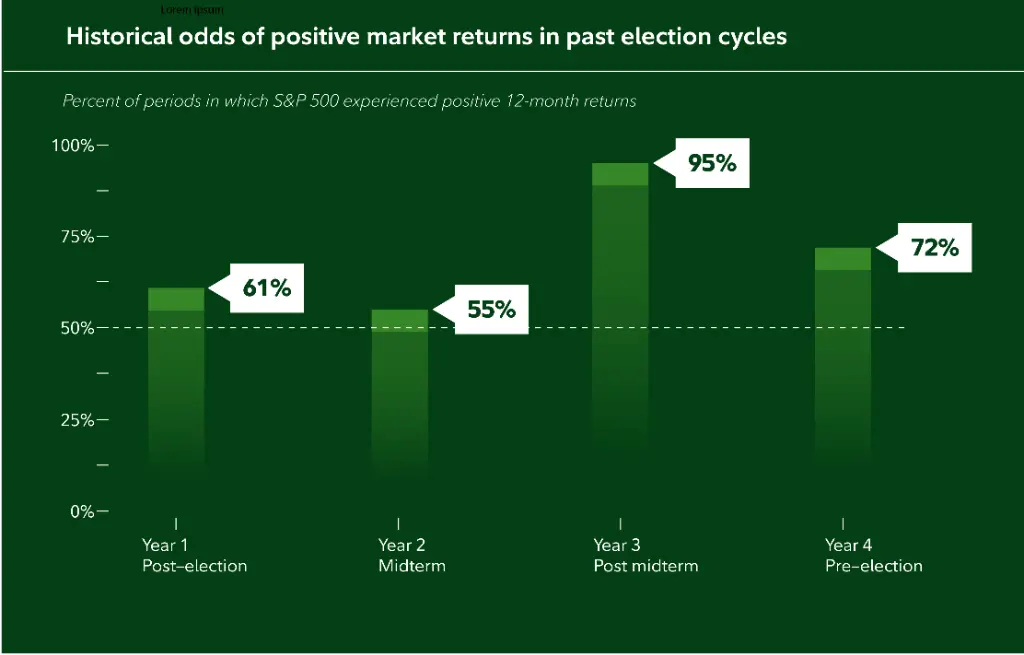
More noteworthy is historical performance. Fidelity's statistics show that since 1938, the S&P 500 has risen in 95% of the 12-month periods following midterm elections, with an average gain of about 14%.
Institutional Positioning Reset, Short Squeeze Releases Upside Room
The core of this bullish thesis is that investors had already completed large-scale de-risking ahead of the election, providing ample "fuel" for a market rebound.
Hedge funds continued to cut U.S. equity exposure and add to shorts before the November vote, with equity short positions briefly near five-year highs; systematic investors also compressed positions in tandem.
JPMorgan said that October's hedge fund deleveraging and AI position liquidation had created a more favorable backdrop for U.S. equities. The bank's U.S. market intelligence team, led by Andrew Tyler, maintained a tactical bullish stance in its Wednesday report and recommended a "barbell strategy" of tech and cyclical stocks, with a modest tilt toward cyclicals.
Scott Rubner of Citadel Securities wrote in a client note:
"With the election behind us and volatility likely to normalize, there is considerable room for investors to rebuild risk exposure. We believe the path of least resistance for U.S. equities through year-end is higher."
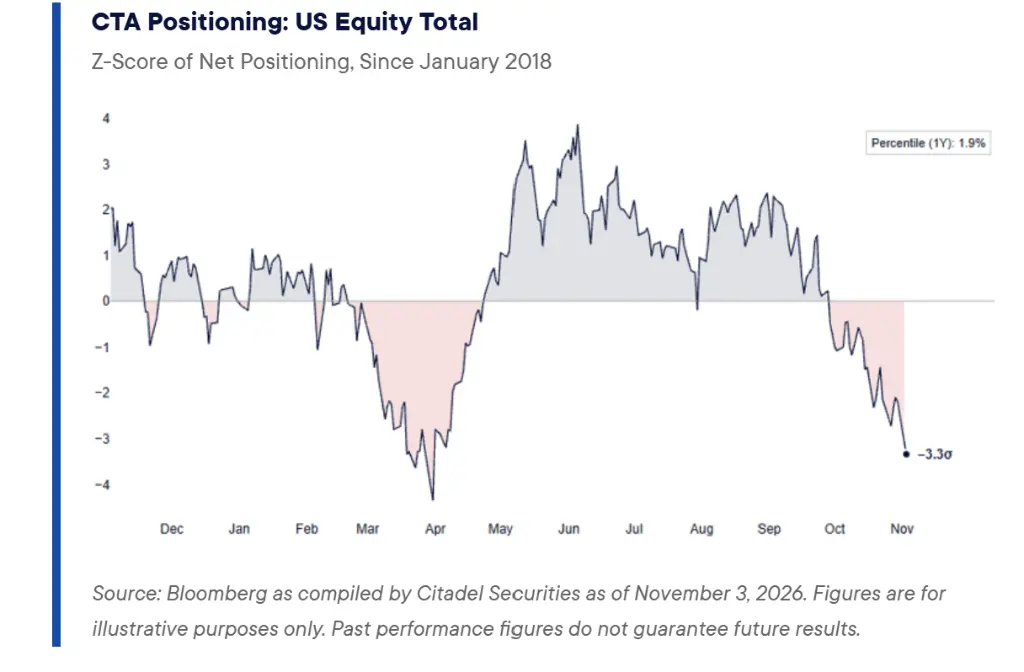
Citadel Securities data shows that systematic trend-following strategies (CTAs) currently hold net U.S. equity positions at roughly -3.3 standard deviations, in the 10th historical percentile since 2018, the lowest level since March 31 this year, and a sharp decline from +1.7 standard deviations three months ago. Once the market sustains its footing at key technical levels, trend-following strategies could trigger systematic buying.
Retail and Buybacks Provide Dual Support, Structural Buying Emerges
Positive signals are also emerging on the demand side, with retail investors and corporate buybacks forming a synergistic effect.
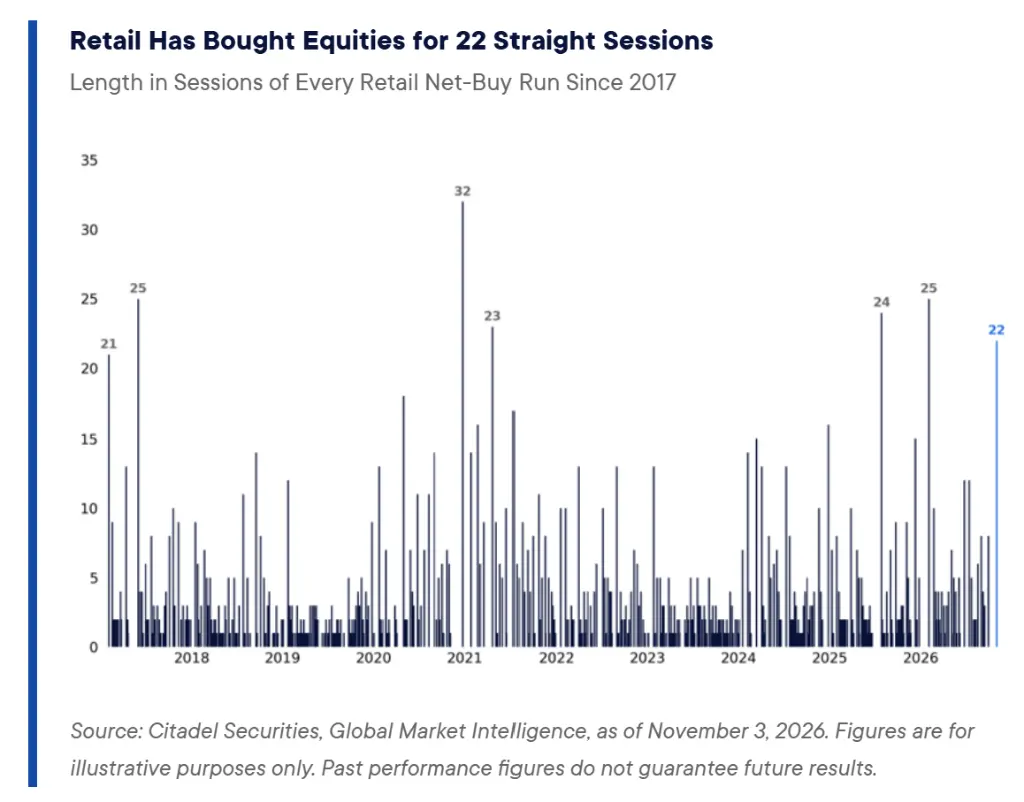
Citadel Securities data shows that since October 5, retail investors have net bought U.S. equity cash products for 22 consecutive trading days, accumulating nearly $33 billion—the sixth-longest and fifth-largest buying streak since 2017, with average daily buying 40% above the past year's average. Notably, this buying occurred while the S&P 500 fell about 2% over the same period. Year-to-date, retail net buying of U.S. equities has reached $251 billion, surpassing the full-year record set in 2021.
On corporate buybacks, with the Q3 earnings season blackout windows gradually closing, buyback demand is returning at scale. Citadel Securities estimates that in mid-October only about a quarter of S&P 500 constituent market cap was in a buyback-eligible state, but by Election Day that ratio had risen to about two-thirds, and is expected to reach 85% by November 9. As of November 2, new buyback authorizations this year had reached $1.5 trillion, exceeding the previous full-year record. October alone saw $166 billion in new buyback authorizations—more than double the historical monthly average.
Tech Valuations Sharply Compressed, Attractiveness Emerges After Repricing
Beyond technical factors, the dramatic contraction in tech sector valuations is also a key basis for institutional bullishness.
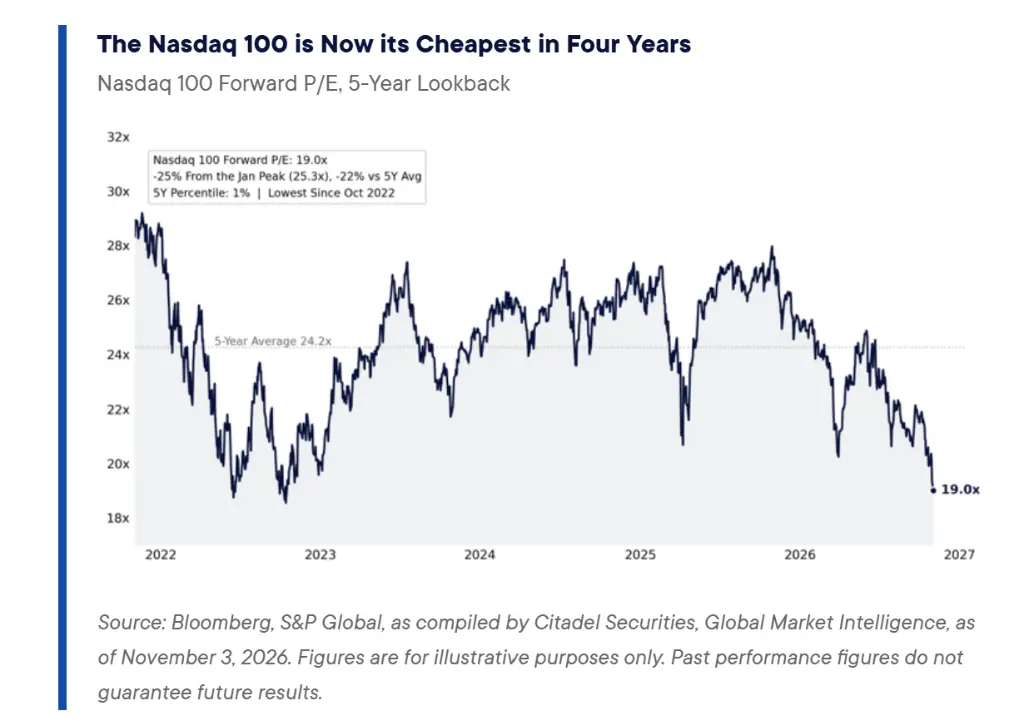
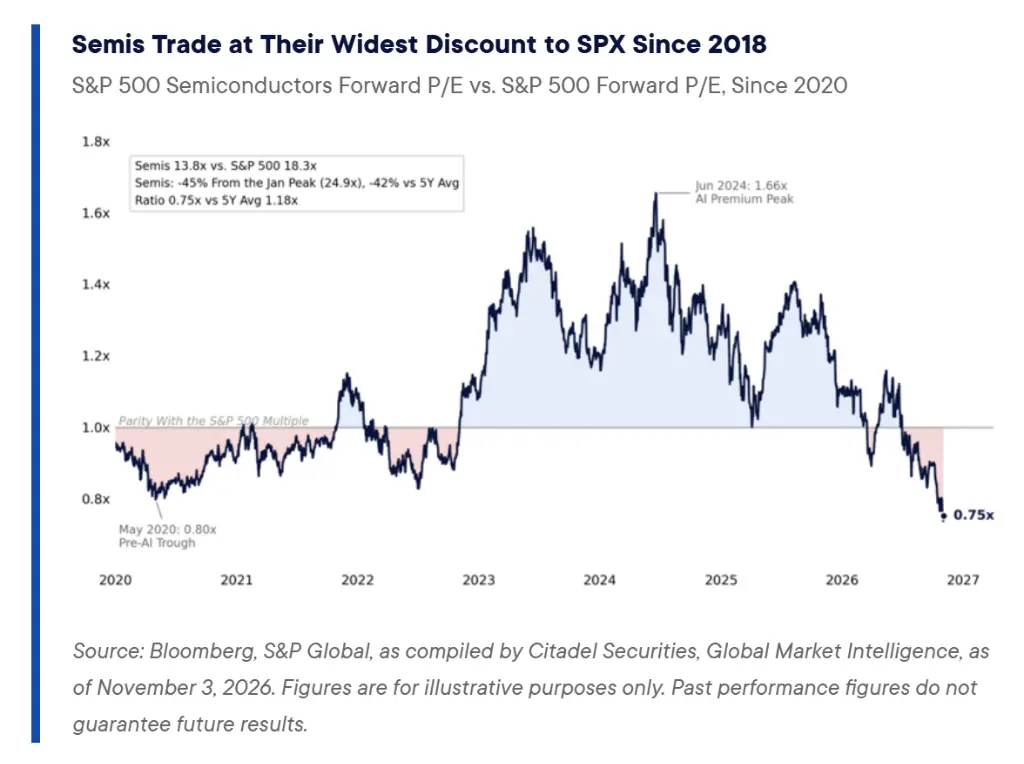
Citadel Securities data shows the Nasdaq 100's current P/E ratio has fallen to 19.1x, the lowest since October 2022 and a 24% discount to the January high. Relative to the S&P 500, the Nasdaq premium has shrunk to just 5%, the lowest since January 2017 and well below the ~20% ten-year average. Semiconductor valuations have compressed even more dramatically—the S&P 500 semiconductor constituents' P/E has dropped to 13.8x, down 45% from the January high and the lowest since July 2022, trading at a 25% discount to the S&P 500, the deepest discount since December 2018.
This valuation reset has occurred against a backdrop of continuously upward-revised earnings expectations. Since June 30, forward EPS estimates for memory, AI infrastructure and semiconductors have been raised by 32%, 31% and 30% respectively, yet corresponding P/E ratios have compressed by 50%, 36% and 35%. So far this Q3 earnings season, 83% of companies have beaten expectations, above the historical average of about 75% and among the top ten strongest readings on this basis since 2005.
Max Kettner, Chief Multi-Asset Strategist at HSBC, said:
"(The current rally) is not just a recovery from the October selloff—it's basically a buy-everything moment."
Policy Landscape Shifts, AI Infrastructure Regulation Expectations Ease
The market has initially digested the policy implications of Democratic control of Congress, with some investors seeing the impact on AI investment as potentially mixed.
Charlie McElligott, cross-asset strategist at Nomura, noted that Wednesday's rally partly reflected investors unwinding hedges after the election outcome, with VIX futures and the VVIX index—which measures options market volatility—both falling sharply, indicating that protective demand accumulated due to election uncertainty and AI concerns is rapidly fading.
He wrote that the market believes the election result will lead to "a forced slowdown in U.S. data center construction, thereby easing concerns about the 'prisoner's dilemma' style unlimited arms race in hyperscaler capex," further reducing credit and equity financing pressure required by the AI boom. Jurrien Timmer, Global Macro Director at Fidelity, also noted that a Democratic blue wave may limit data center expansion, "which could benefit hyperscalers that already hold dominant positions, as well as core members of the 'Mag 7.'"
JPMorgan strategist Nikolaos Panigirtzoglou cautioned that hedge funds, after the painful October selloff, may need several weeks of market stabilization before rebuilding AI exposure.
Anthropic IPO Seen as Key Catalyst for Full Tech Bullish Turn
Beyond the multiple tailwinds above, institutions are also awaiting a catalyst viewed as the "ultimate clearing event" for tech sentiment.
HSBC's Kettner said: "For me, the real clearing event is the Anthropic IPO. Once the Anthropic IPO is announced and successfully completed, I think that's when you can go fully long tech and sell those defensive assets that rallied sharply in October." The deal is expected to be one of the largest IPOs in history and carries significant signaling value for restoring overall tech sentiment.
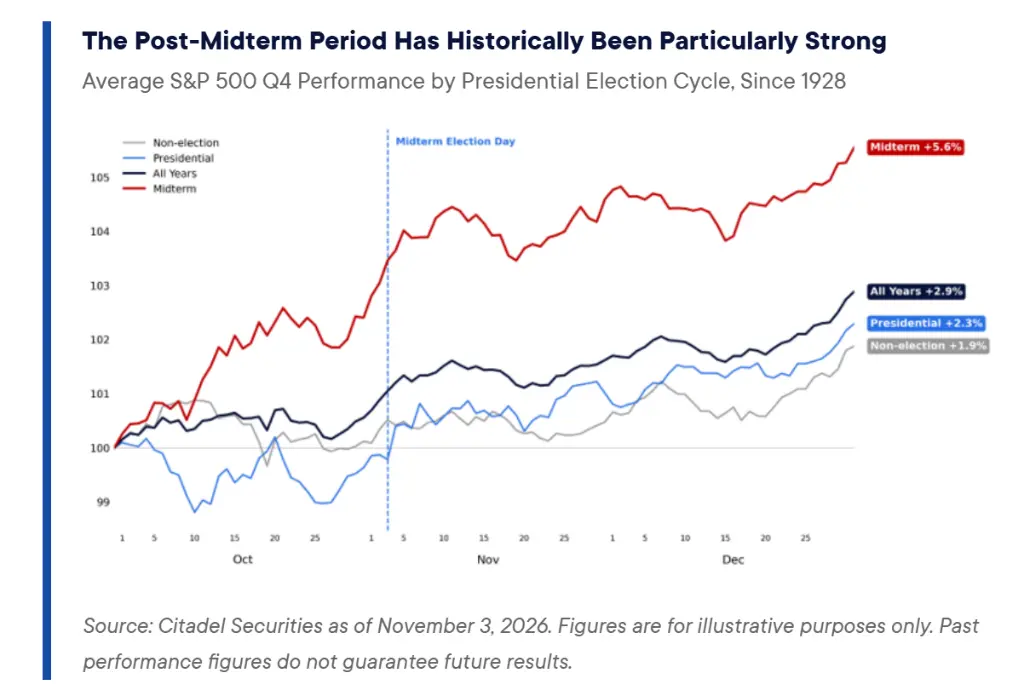
Historical data also supports the year-end outlook. Citadel Securities data shows that since 1950, the S&P 500 has risen in every 6-month and 12-month period following midterm elections, with a median 12-month gain of 14.5%. The fourth quarter of midterm election years has historically been the strongest quarter in the U.S. presidential cycle, with the S&P 500 averaging a 5.6% gain—above the 2.9% average across all years. This year, entering the post-election phase, the market has lagged the typical midterm-year seasonal trajectory. Historically, nearly 60% of midterm-year Q4 lows have occurred in October, followed by a median gain of nearly 10% through year-end.
Risk warning and disclaimer: Markets carry risk; invest with caution. This article does not constitute personal investment advice and does not take into account the specific investment objectives, financial circumstances or needs of individual users. Users should consider whether any opinions, views or conclusions in this article are suitable for their particular circumstances. Invest at your own risk.