






Author: Glassnode
Translation: AididiaoJP, Foresight News
Global markets keep printing all-time highs while Bitcoin sits still. This report zooms in on that stillness: a theft the market barely registered, a bottom that's being assembled through boredom rather than capitulation, and an options market priced for "nothing will move" while sentiment flips on every breeze.
Summary
• Equities and gold ripped; crude was repriced sharply to the downside. Bitcoin barely moved.
• 594 BTC was stolen, while dormant-coin flows ran 200x the stolen amount — and price ignored both.
• Bottom signals are assembling through boredom, not capitulation, yet still haven't touched the true floors of every prior bear market.
• The institutional bid of the past two years is still running in reverse.
• Options are priced for little movement in either direction, while sentiment flips on every small wiggle.
• Historically, this kind of deep squeeze almost always resolves to the upside; this time, the demand engine still hasn't turned on.
The Week Bitcoin Sat Out
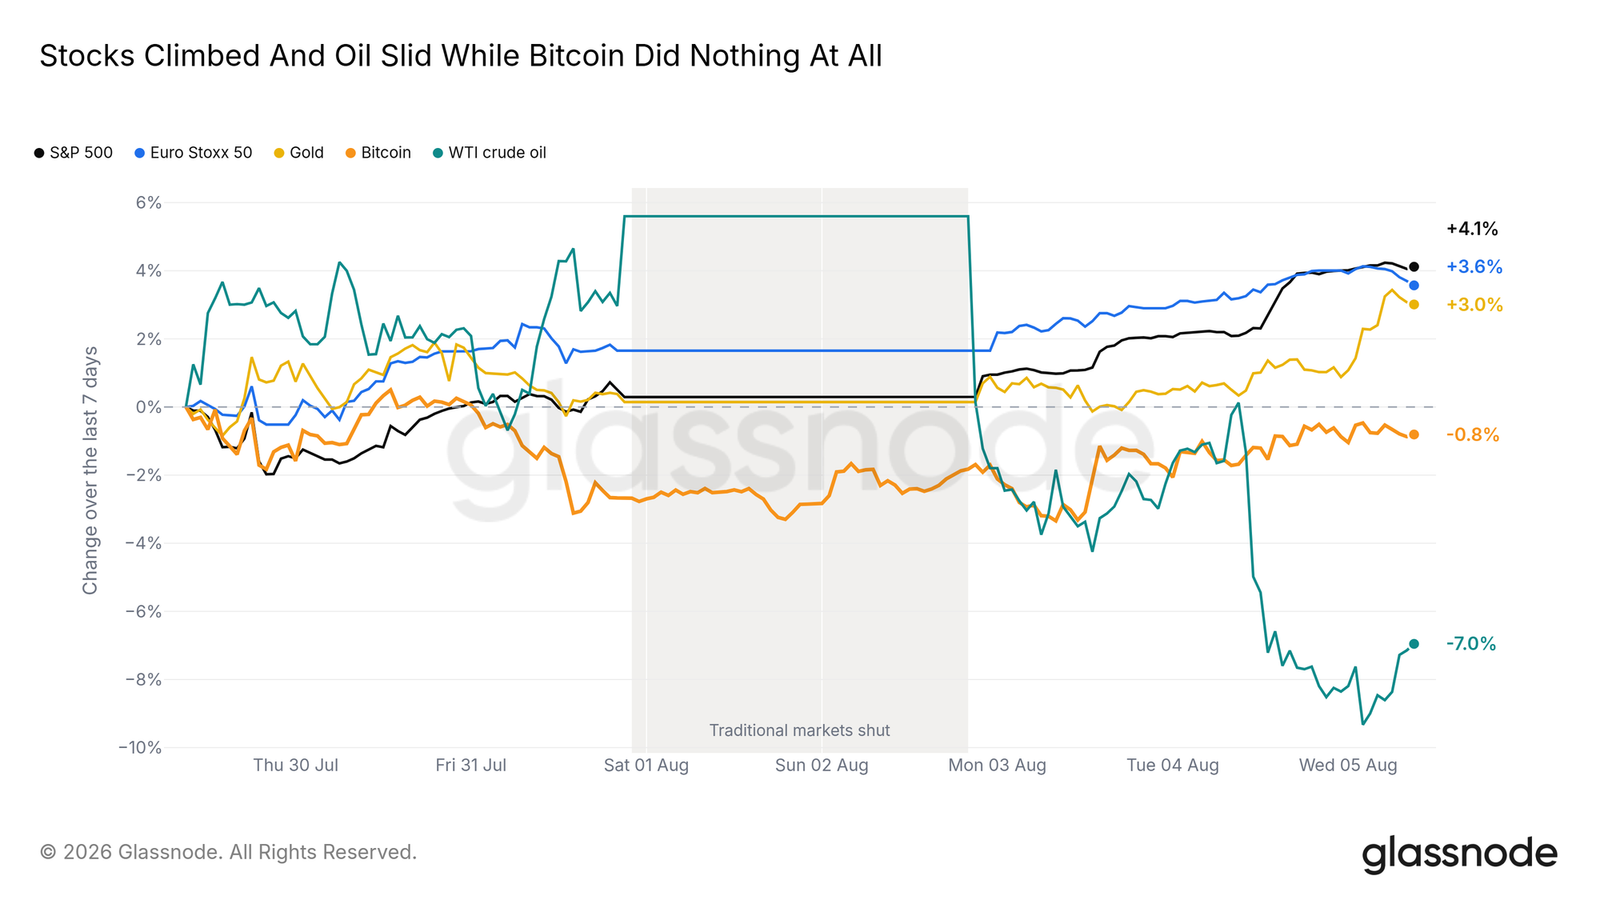
Put the major markets on the same axis, zero-based, and the week tells the story at a glance. Both major equity indices broke records, gold rose in tandem, while crude gapped sharply lower on Sunday as downgrade jitters instantly erased the supply risk premium. Bitcoin — the only asset that trades on weekends too — finished slightly below where last week's report left it, lagging the S&P 500 by more than four percentage points. Everything moved except the protagonist of this report. The rest of this piece is an attempt to explain that.
Fed Holds, Fear Evaporates Fast
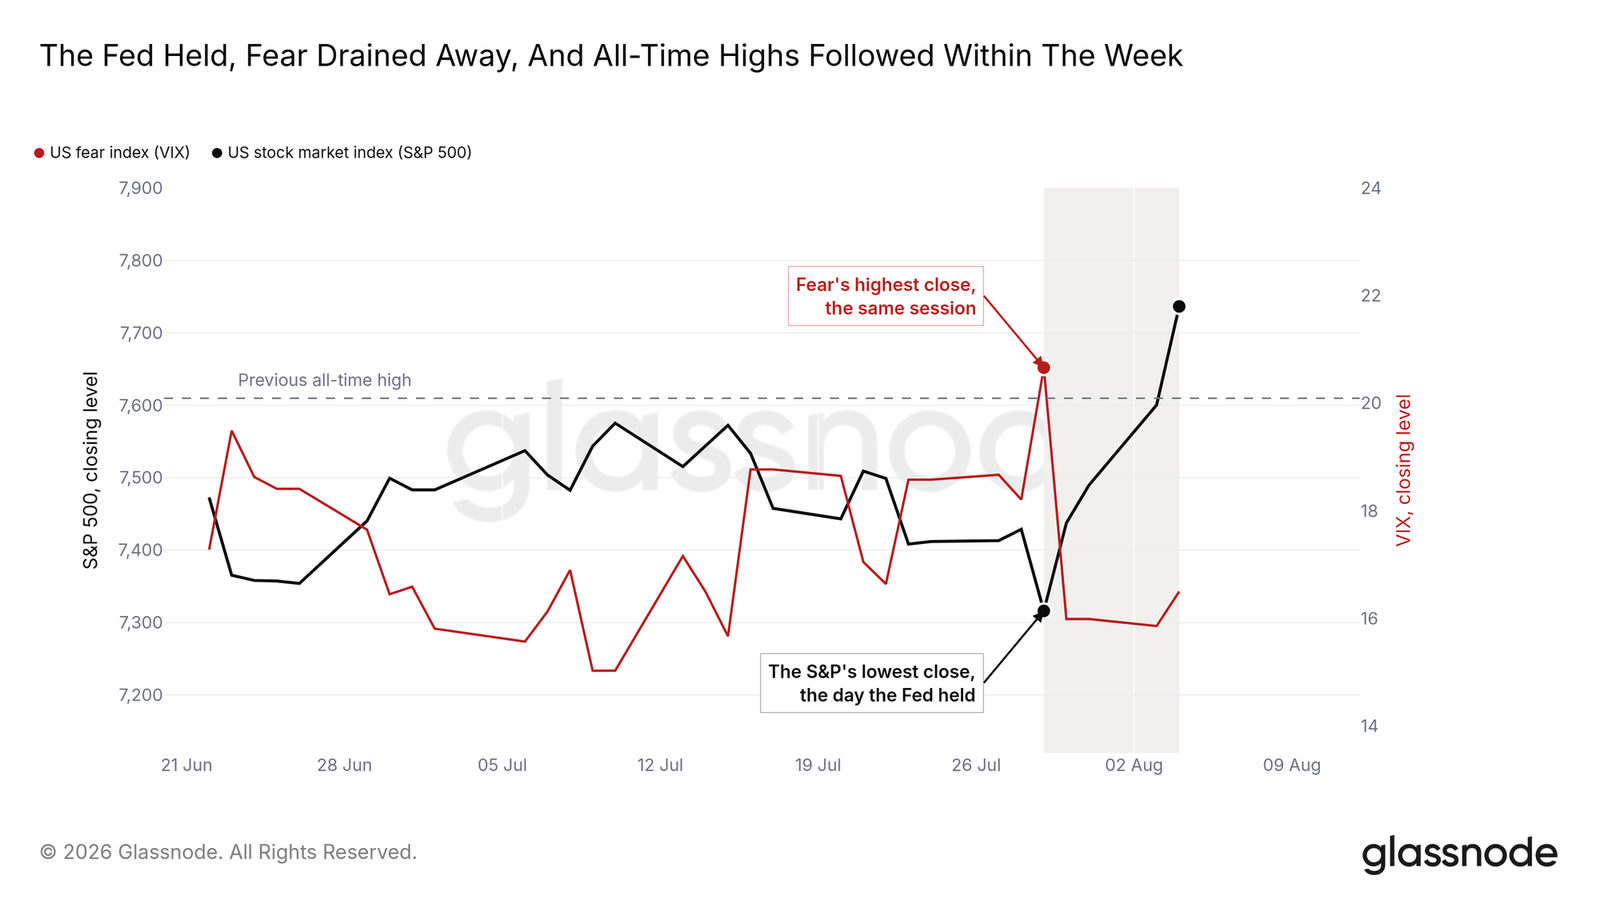
Equities were hanging on the FOMC. On July 29 the Fed held rates steady, and the market's first reaction was to sell: the S&P closed at its summer low and equity fear spiked to a peak. The reassessment took exactly one trading day. The speed at which fear faded is something that's happened only ten times since 2009. Four days after the decision, the index closed at 7,737, breaking above its June record high — the same day the Euro Stoxx 50 set its own record. The key is the sequence: the market sold "patience" first, slept on it, then spent four days deciding "patience" was actually good news.
Forward Data Turns Up
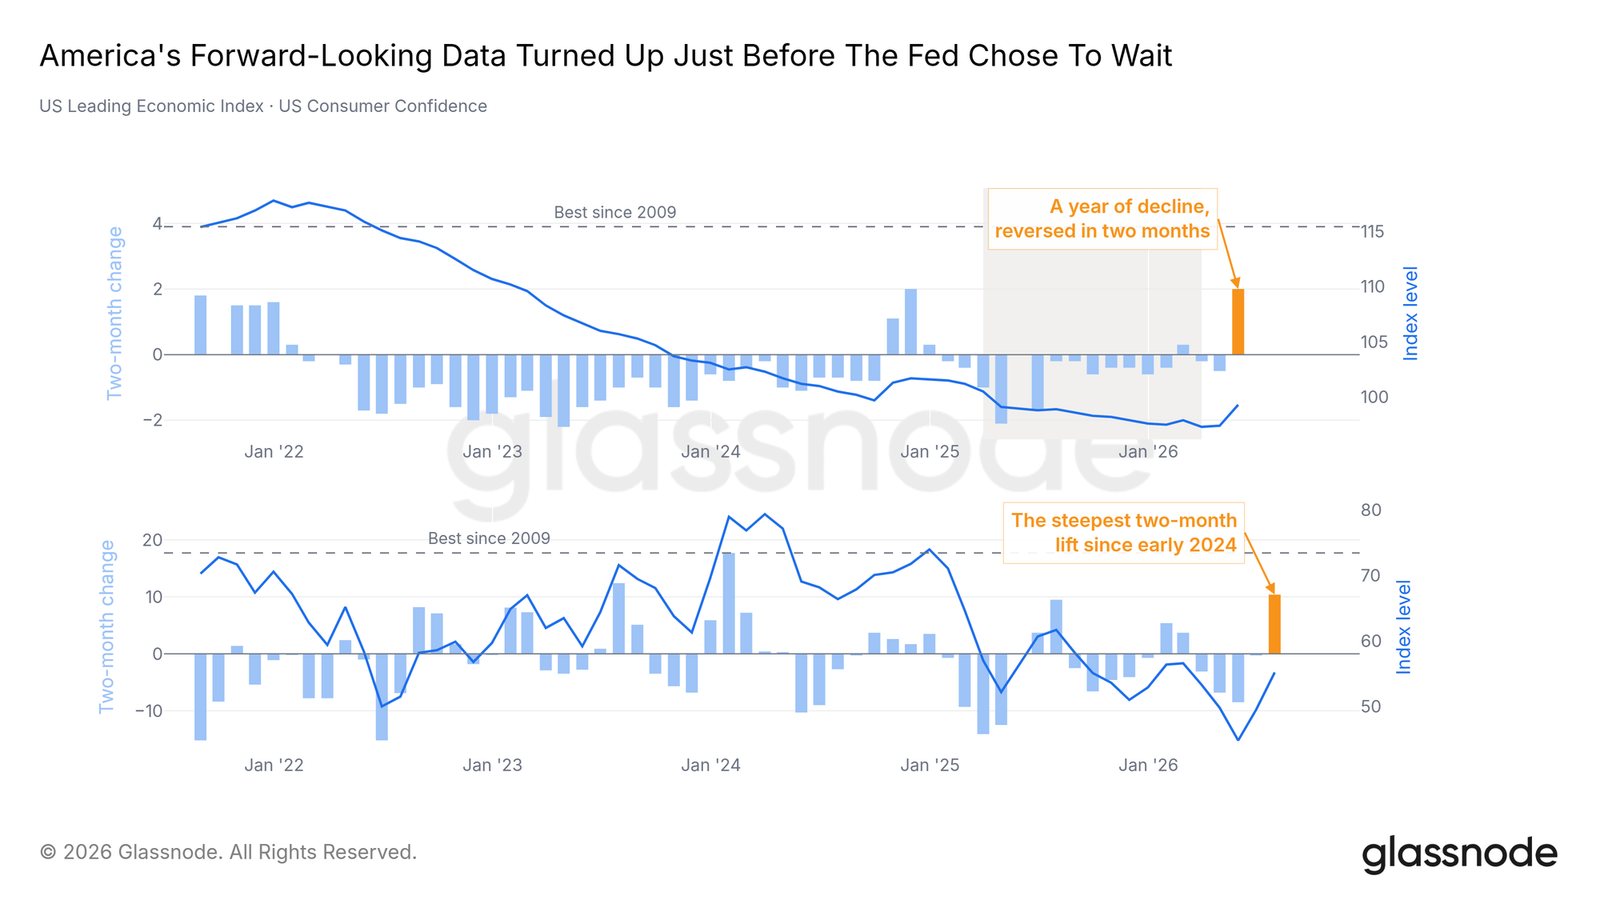
The hold was read as good news because the underlying data had turned. The Leading Economic Index reversed a year-long decline within two months, and consumer confidence posted its steepest two-month gain since early 2024. A central bank standing still while forward indicators improve removes the risk of further tightening and lets growth do the work — equities priced exactly that. Bitcoin priced none of it. Whether its stillness is weakness or anesthesia, the data ahead will answer.
A 25-Minute Stress Test
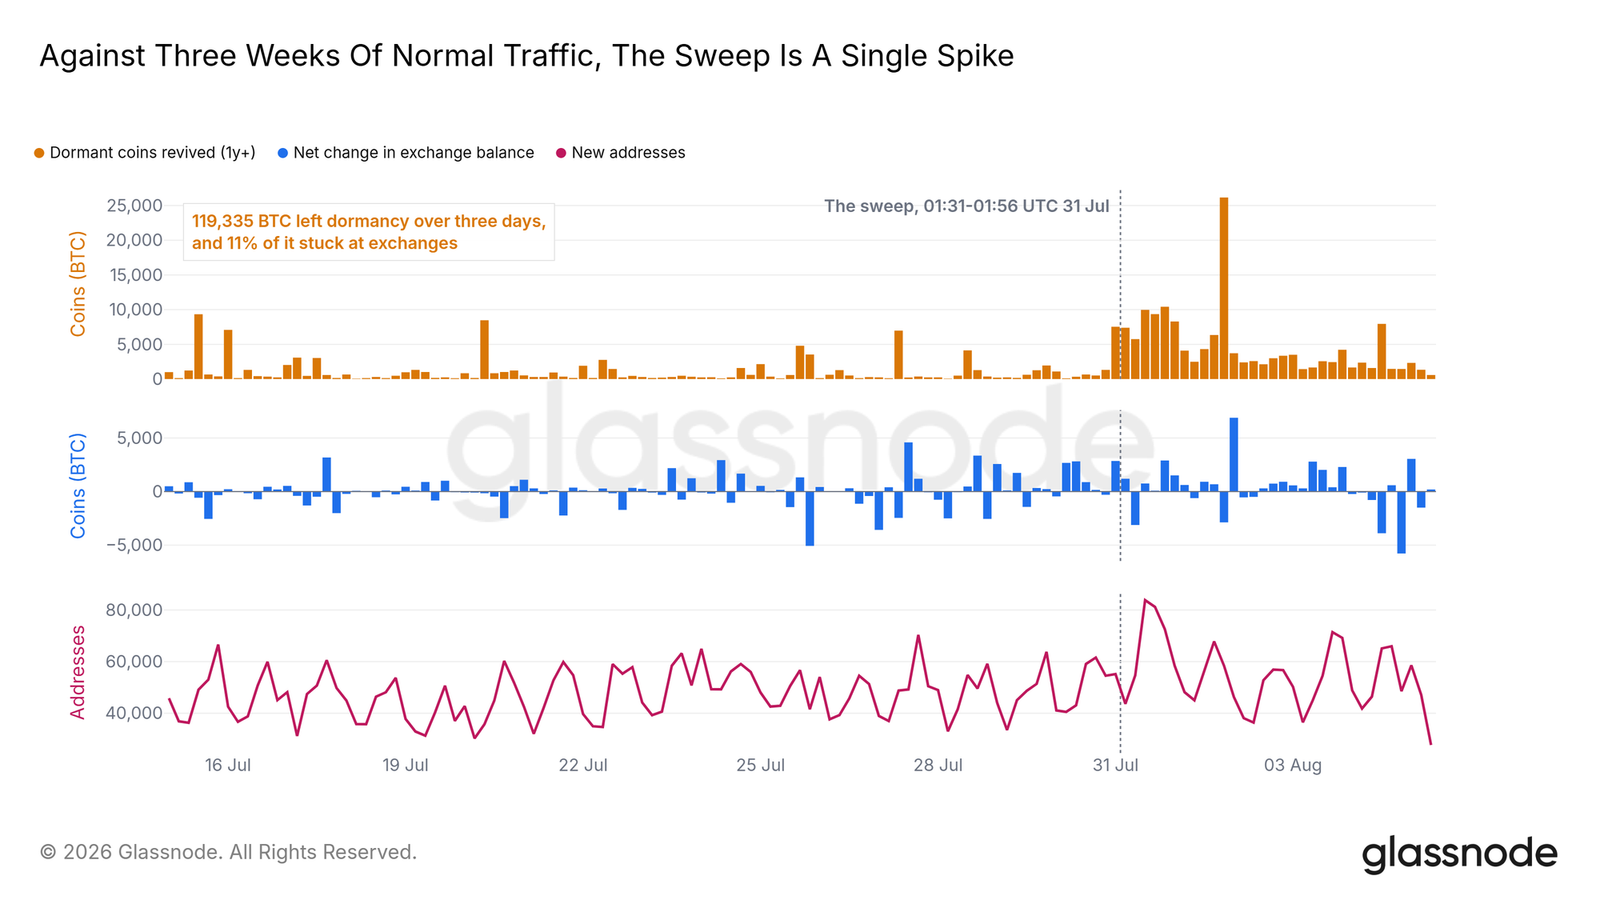
Early Friday, July 31, the market faced a stress test nobody had flagged. In 25 minutes, an attacker exploited a five-year-old key-generation flaw in Coldcard hardware wallets and swept roughly 594 BTC — worth about $38 million — from around 500 self-custody wallets. The theft was nearly over before it began. But the on-chain reaction it triggered lasted for days, making it the cleanest natural experiment in holder behavior this cycle.
"Revived supply aged 1y+" (coins older than a year that moved again) surged to roughly 119,000 BTC over the following three days — 200 times the stolen amount. Holders across the ecosystem moved coins out of potentially compromised seeds. Against three weeks of normal flow, this was an isolated spike. Only about a tenth of it ultimately hit exchanges; new addresses returned to baseline within three days, and wallet supply held less than a month is up 40% since, still climbing. This was a migration to new cold storage, not a liquidation event.
On the spot side, the event barely registered. The largest forced movement of old coins this cycle produced no measurable selling pressure and no discernible price reaction. A market that can shrug off a robbery of its core self-custody cohort has neither active bids nor active offers — which is exactly the state the cycle indicators describe next.
Bottom Zone, but No Capitulation Washout
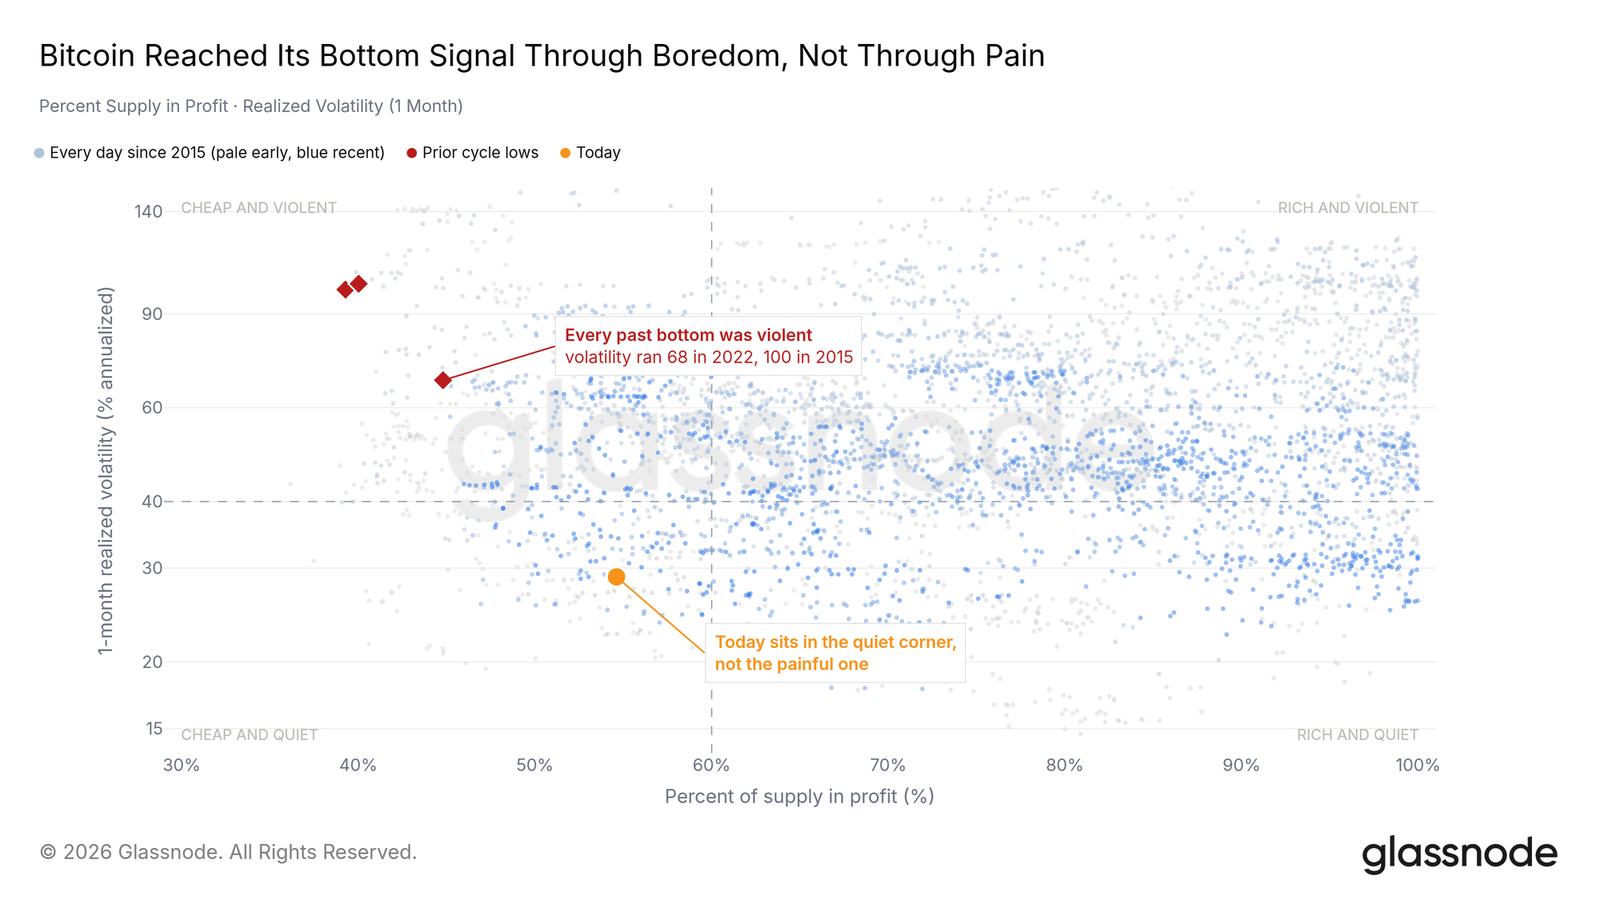
Bottom signals assembled through boredom
Bitcoin bottoms usually arrive through pain: a capitulation flush that pushes the supply-in-profit ratio to extremes while volatility spikes. This cycle reached the same neighborhood through boredom instead. Profit compression is in place, but it was ground out over months of grinding decline, arriving with volatility on the floor rather than the ceiling. The destination is familiar; the path there has no precedent in prior bottoms.
At the doorstep, not in the room
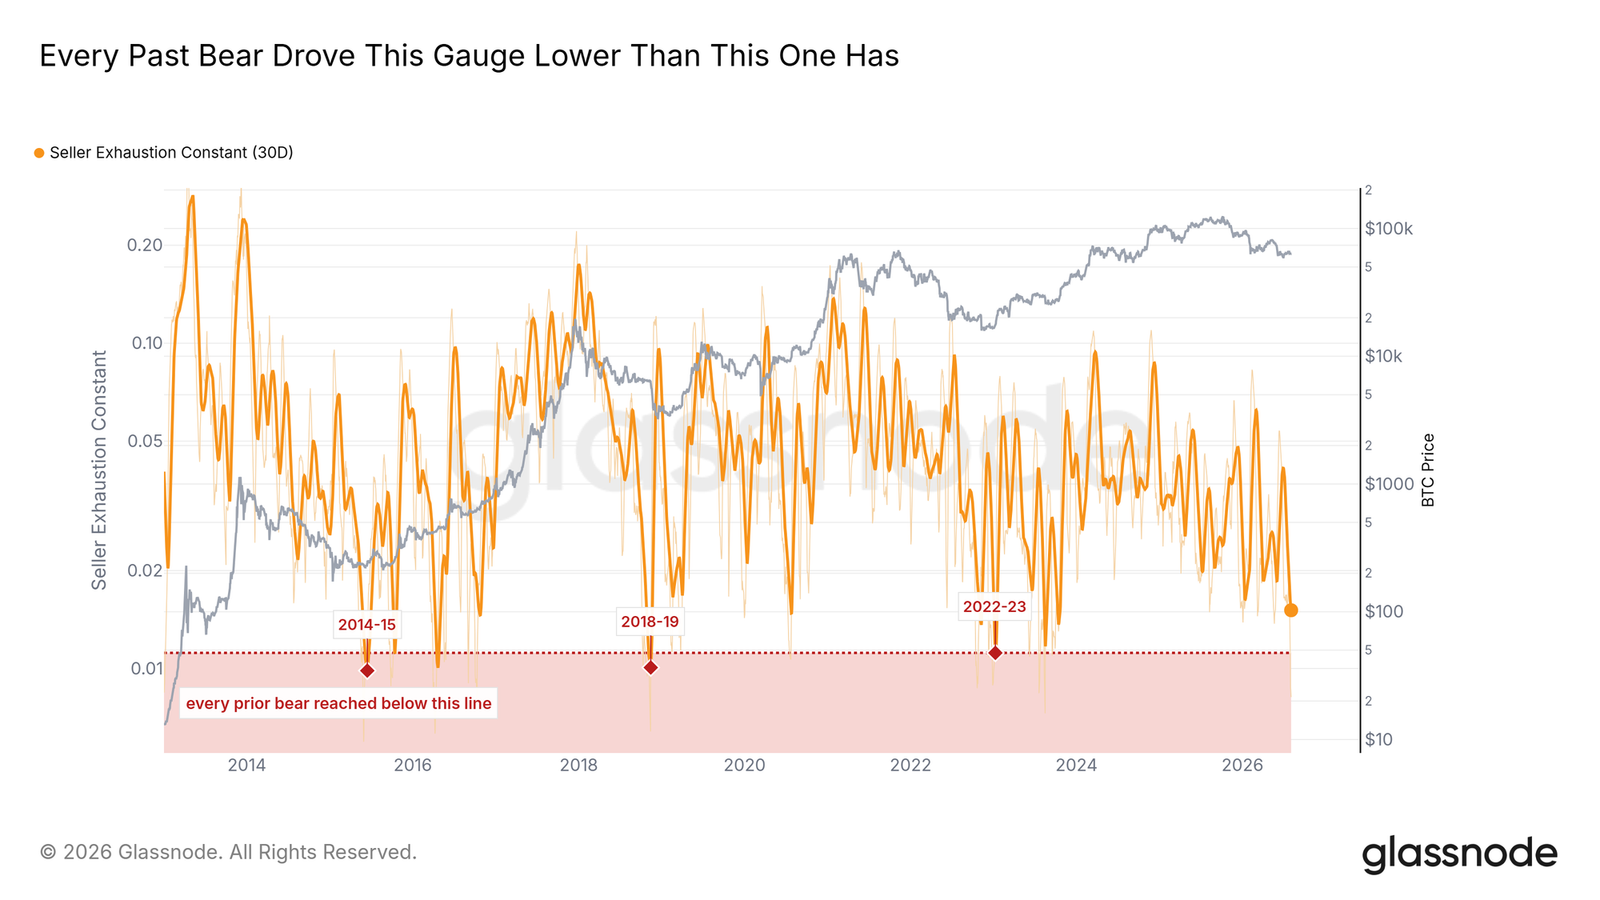
The "seller exhaustion constant" (supply-in-profit ratio × realized volatility) makes this clearer. Its 30-day average sits at cycle lows, already in the zone where every prior bottom formed — but still roughly a third above the floors every prior bear market ultimately touched. The indicator is at the doorstep, not in the room: if past cycles are the template, the final flush hasn't come yet.
The track is running in reverse
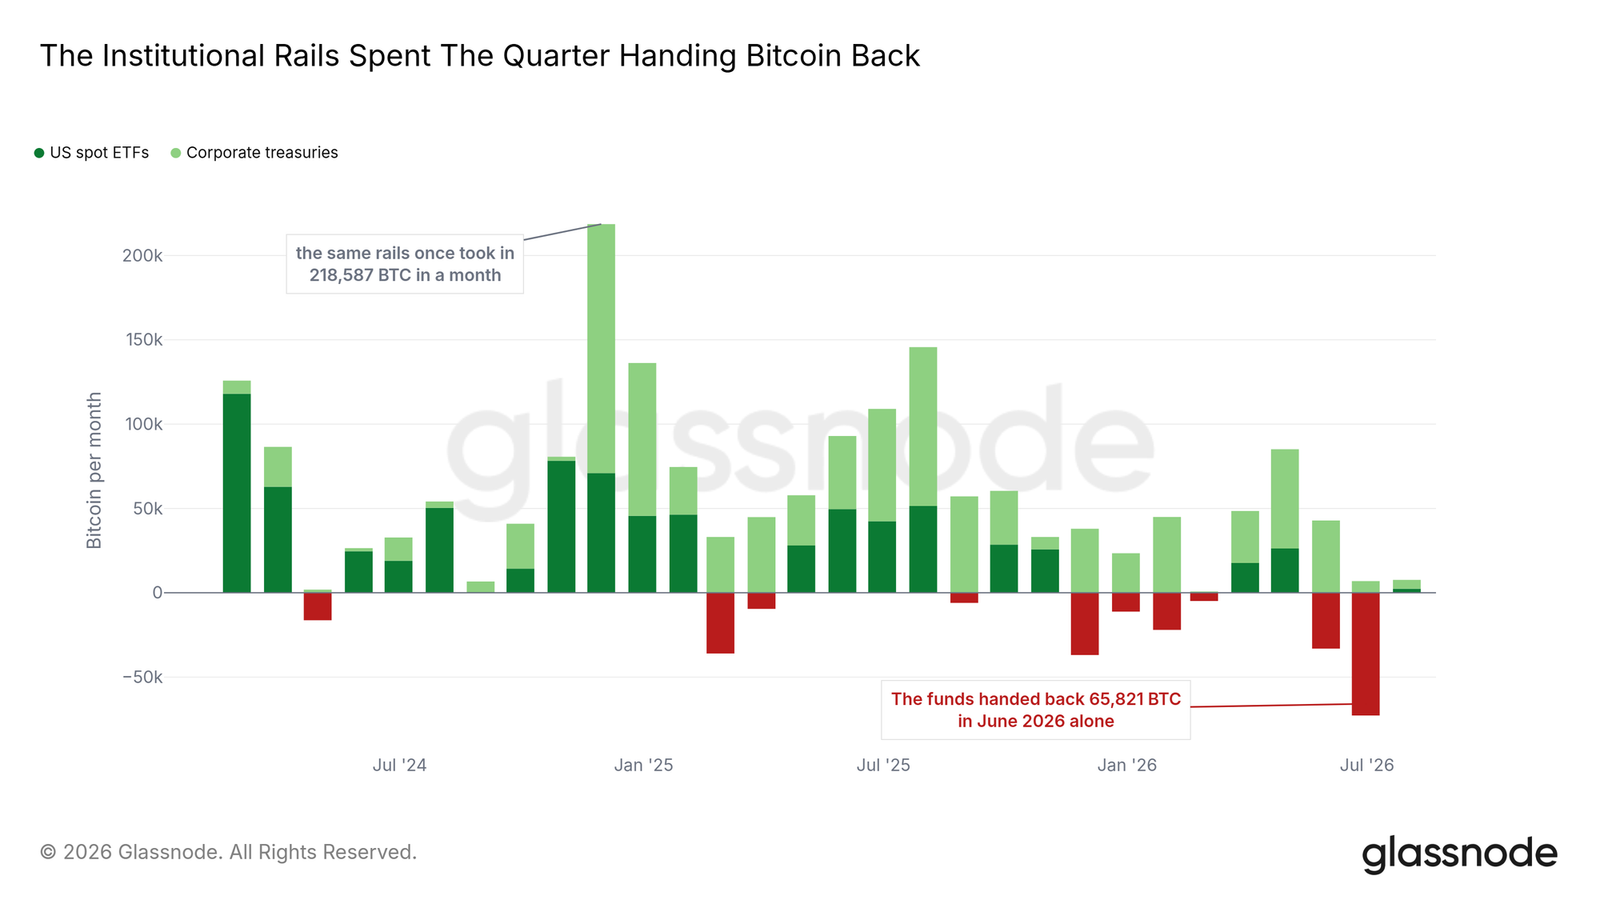
The demand side tells the matching story. The institutional tracks of the last bull — US spot ETFs plus corporate treasuries — have been handing coins back for the past quarter: in June alone, funds saw net outflows of roughly 65,800 BTC, the worst month on record, versus the best month ever at the end of 2024 with net absorption above 218,000 BTC. Corporate treasury buying continues, but not nearly enough to offset fund outflows. However the bottom forms, it must form with the structural bid that defined the past two years absent — until that bid turns back around.
From risk-off to defensive
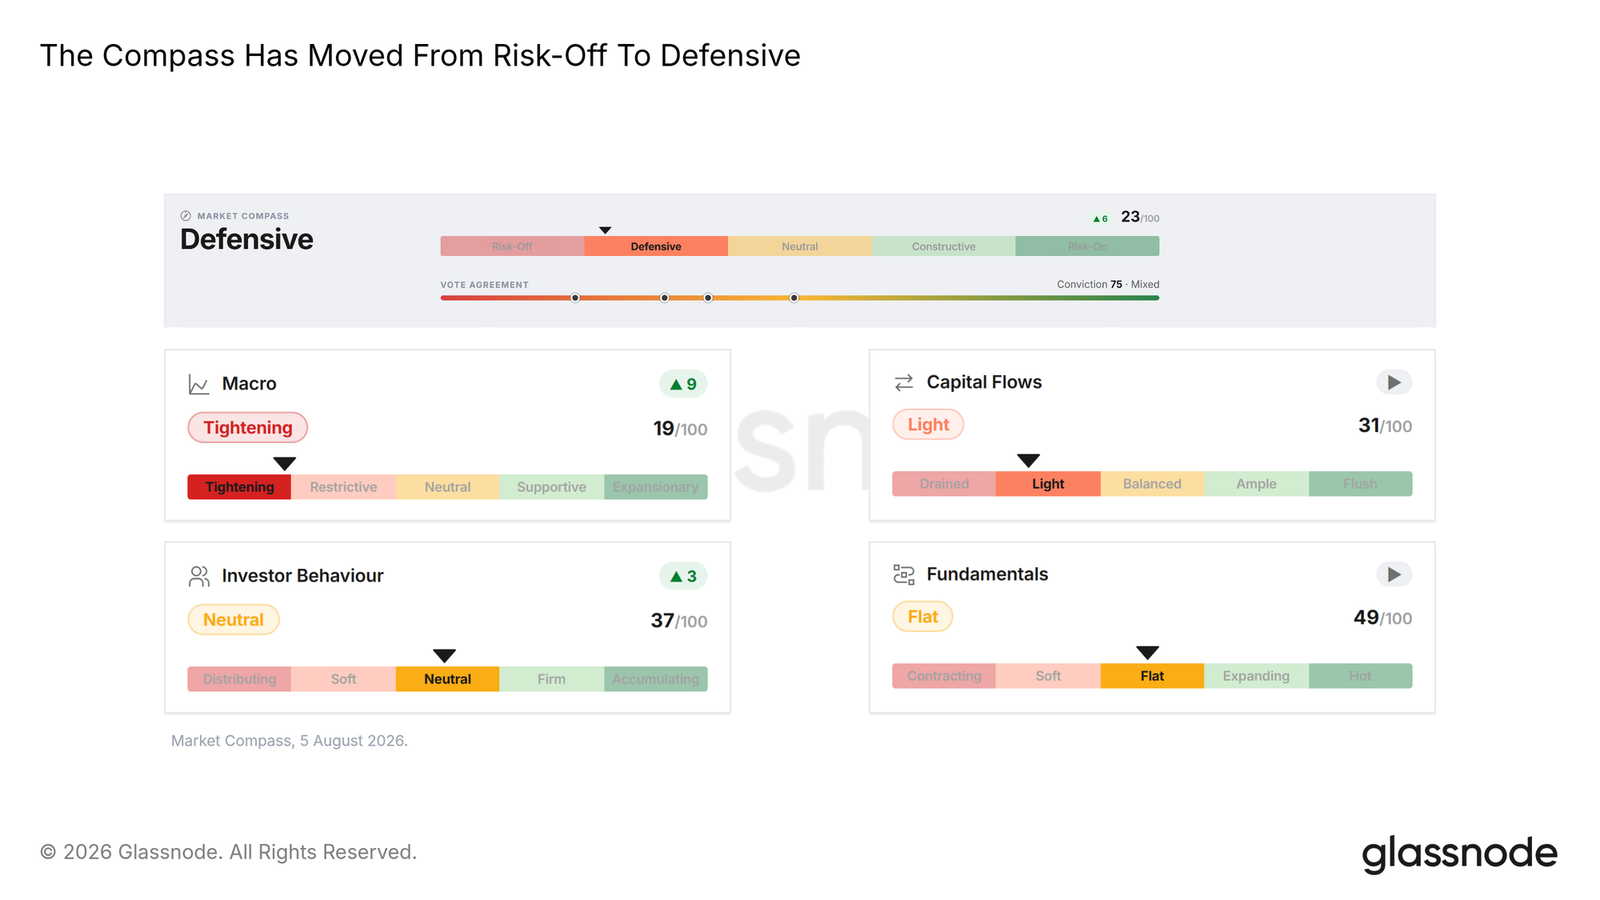
Our market compass summarizes the current state: after nearly three weeks pinned in risk-off territory, the composite indicator has crawled into the defensive zone, with inputs broadly aligned. Defensive means the market has stopped deteriorating but has no momentum yet. The bottom checklist is half-checked; the unchecked half is all waiting on the same missing ingredient: a forcing event.
Nobody is paying for direction
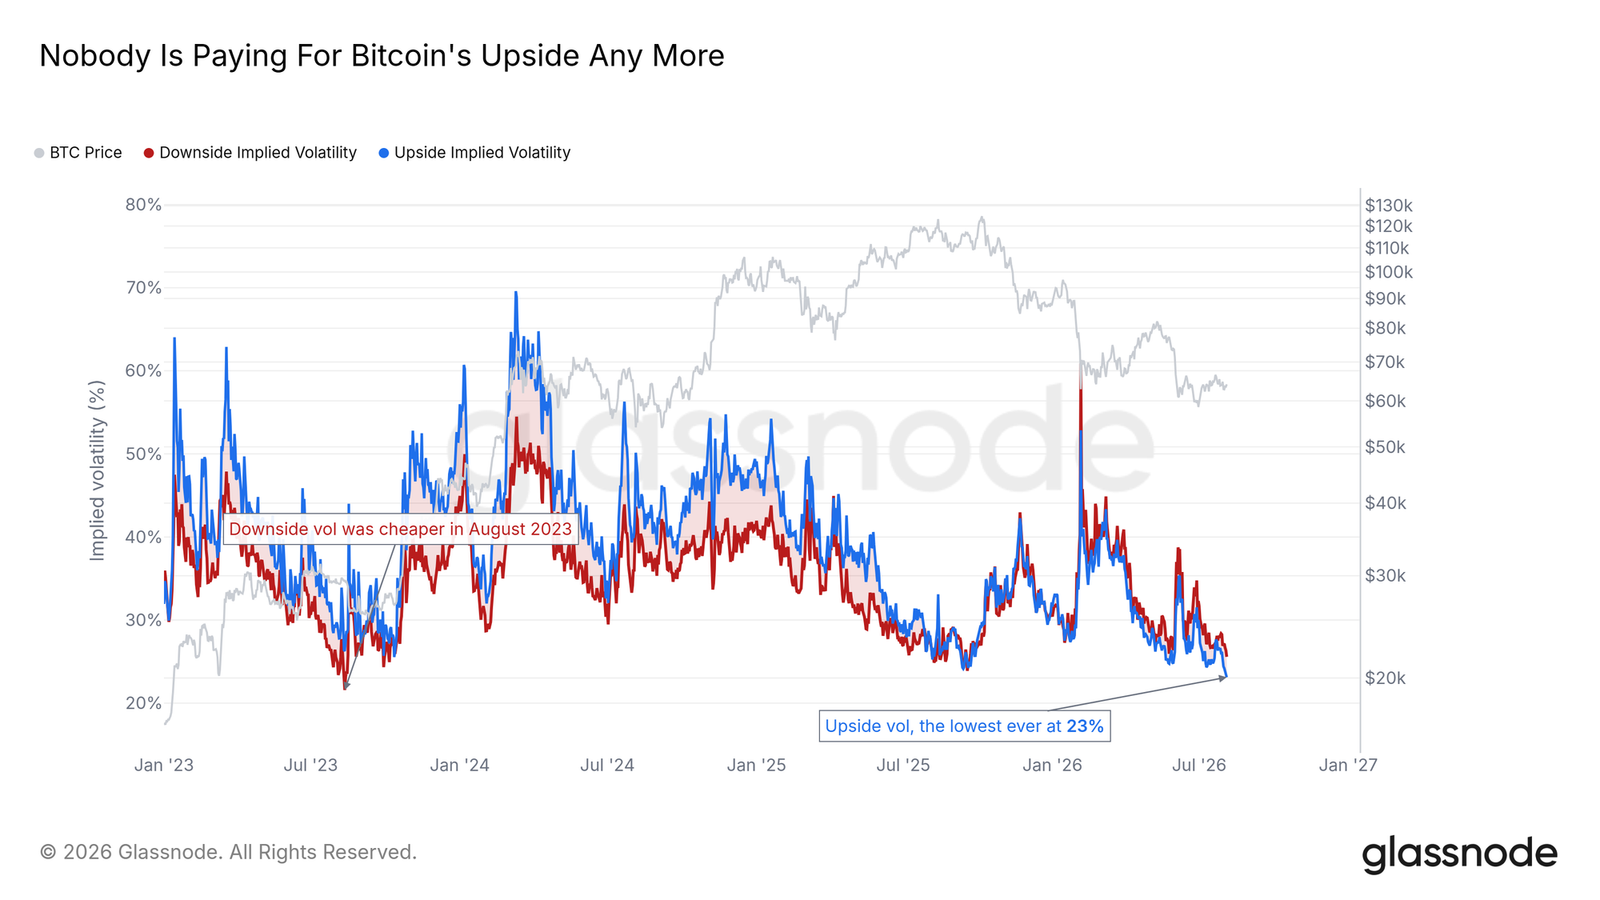
Split the options surface into two wings, and Bitcoin's much-hyped "fear premium" is actually stranger than that. Upside implied vol printed the lowest level in the indicator's history, near 23%; downside implied vol is unremarkable — the last time it was cheaper was August 2023. This asymmetry isn't a bid for puts; it's the disappearance of call buying. Nobody is paying for upside, and hardly anyone for downside either.
Sentiment can't sit still
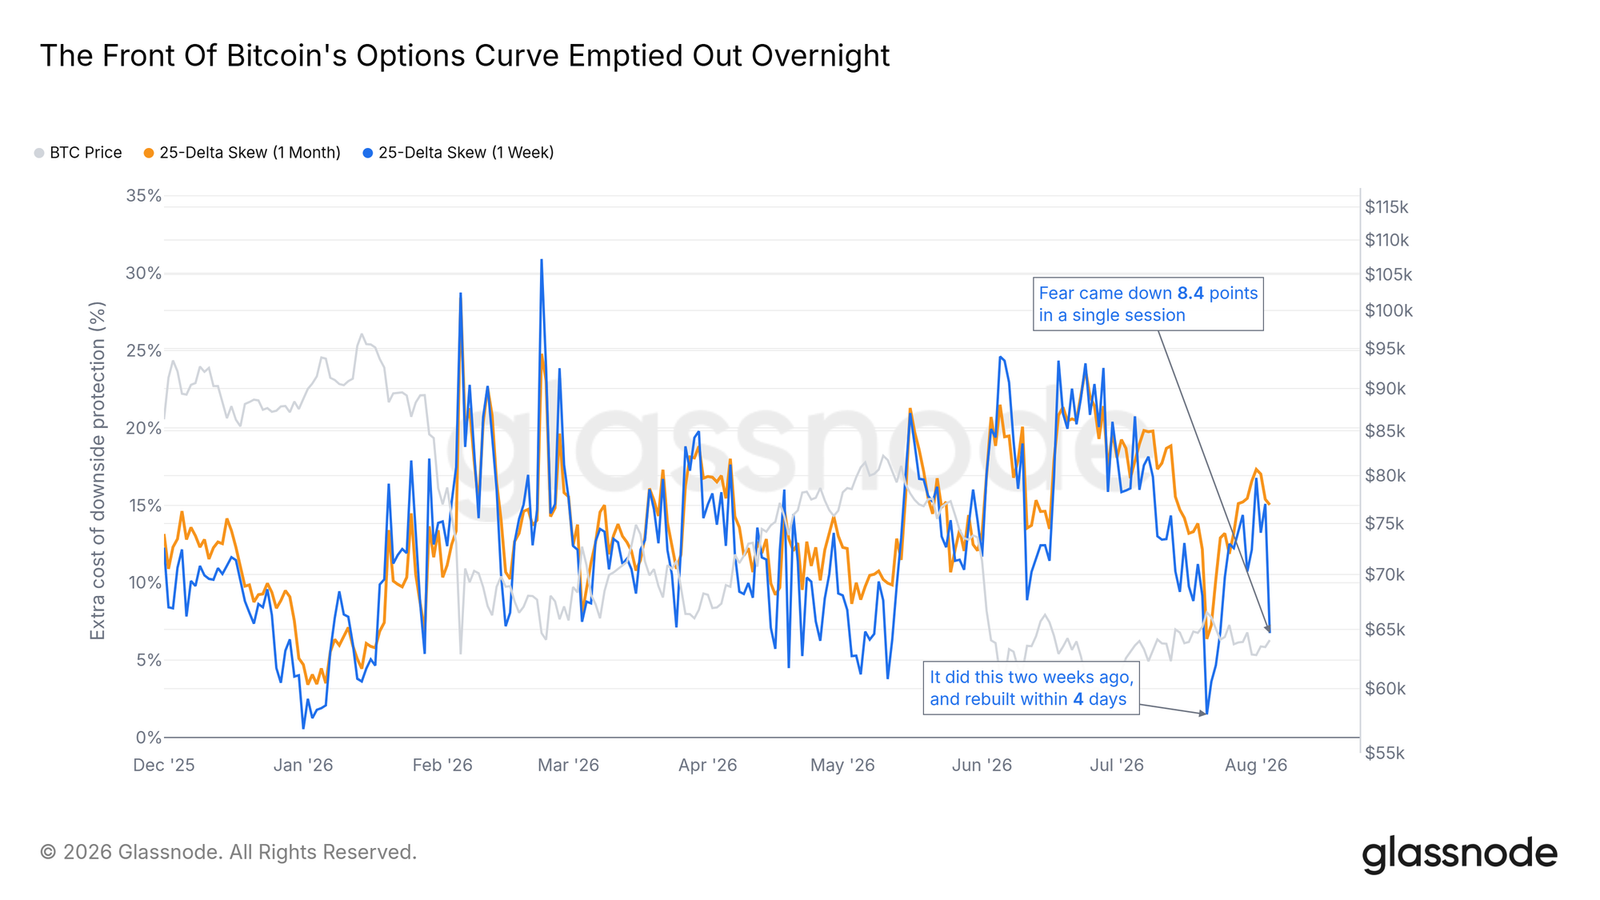
Meanwhile, sentiment can't sit still. Our fastest positioning gauge — 1-week 25-delta skew — crashed more than eight points in a single day this week while spot barely moved; two weeks ago at the July highs, the same vacuum opened and closed within four days. Short-term fear pricing flips back and forth on moves of just a few percent, while the volatility being priced lies on the floor. The whipsaw is almost entirely in options: perpetual funding is pinned at long-term norms, so leverage isn't the amplifier — sentiment is. The market bought a week of calm while continuing to pay a premium for six months of risk.
History has a view
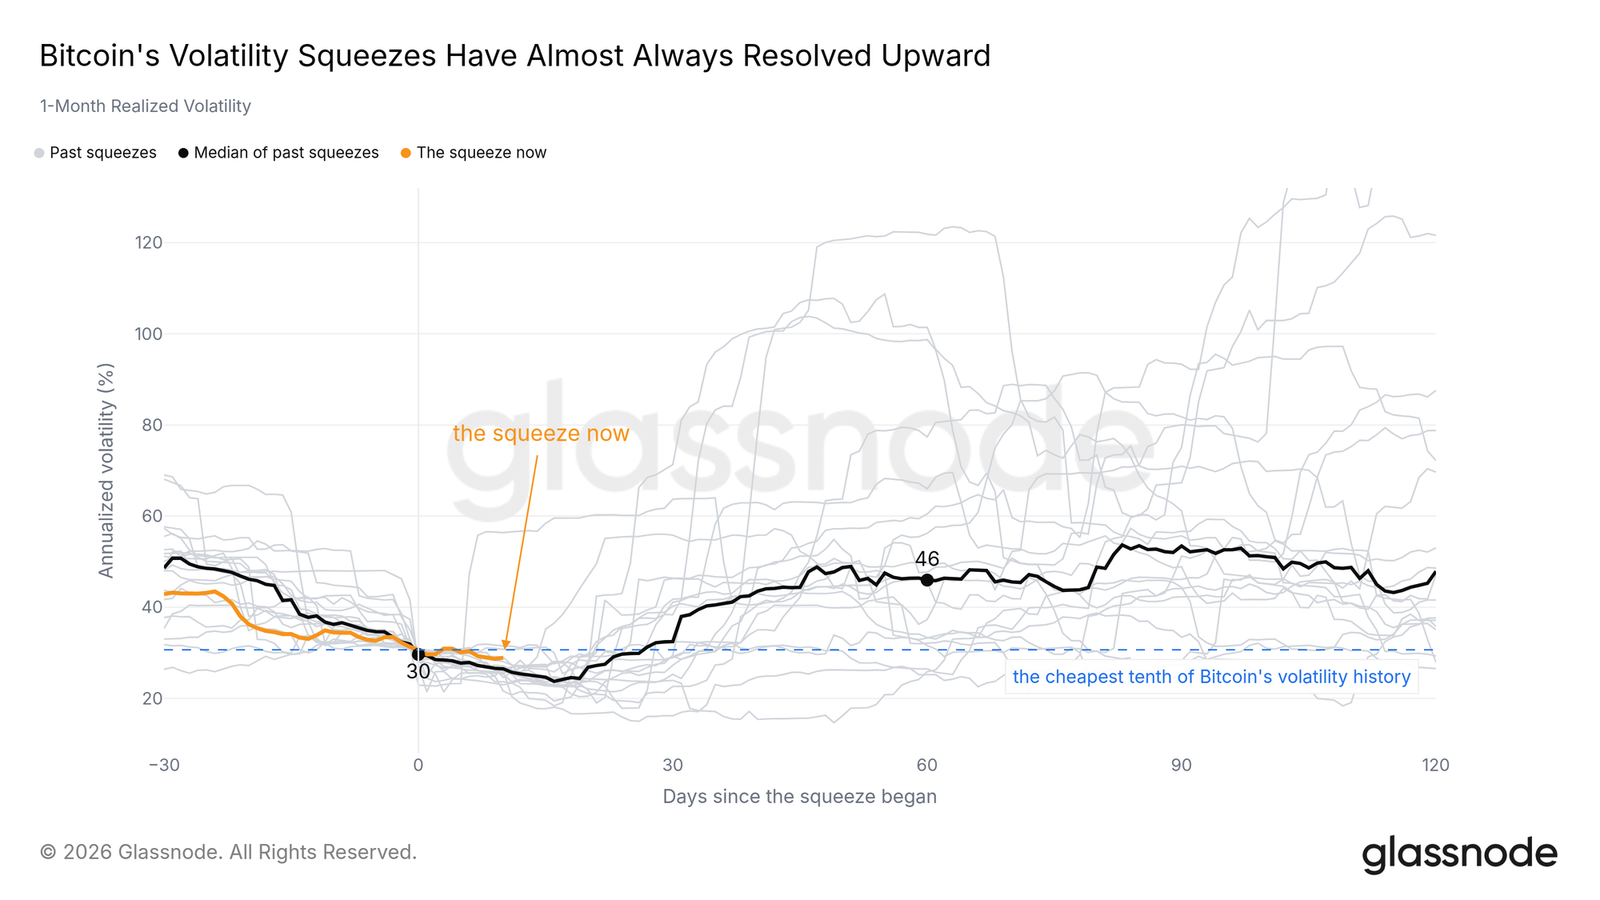
History has a view on this kind of compression. When 1-month realized volatility gets squeezed to similar depths, the release almost always resolves to the upside — that base rate is the most constructive data point in this report. But there's a caveat: past squeezes mostly resolved with the demand engine idling in the background, whereas this time, the track is in reverse and the final flush hasn't completed.
Conclusion
One sentence for the current regime: a compressed, underpositioned market being left behind by global risk appetite, with bottom conditions assembling but not yet complete. The compression guarantees the eventual move will look large relative to any positioning, and the hair-trigger front end of the options curve guarantees the crowd will chase late. A return to sustained net inflows on the ETF track, or volatility expanding upward out of the squeeze, would confirm improvement. Pushing the seller exhaustion constant into the zone every prior bear market finally touched would mark the completion of the classic bottom template. "Priced for zero, reacting to everything" is not a stable state.