






While tech stocks attracted bargain-hunting capital and gold rebounded after a sharp decline, Bitcoin continued its downward spiral, "unable to recover." What exactly happened behind the scenes? Why has the once-thriving cryptocurrency market become "a dismal sight"?
On Friday (November 14), the U.S. stock market experienced a dramatic reversal. After an initial wave of panic selling, investors scooped up tech stocks at discounted prices, leading to a strong rebound in the Nasdaq and S&P 500 after hitting key technical support levels. Gold, which had plummeted by over $150 during the session, also recovered to around $4,080. However, Bitcoin stood out as a clear exception: it fell 5% on the day, breaking below the $94,000 mark and hitting a six-month low.
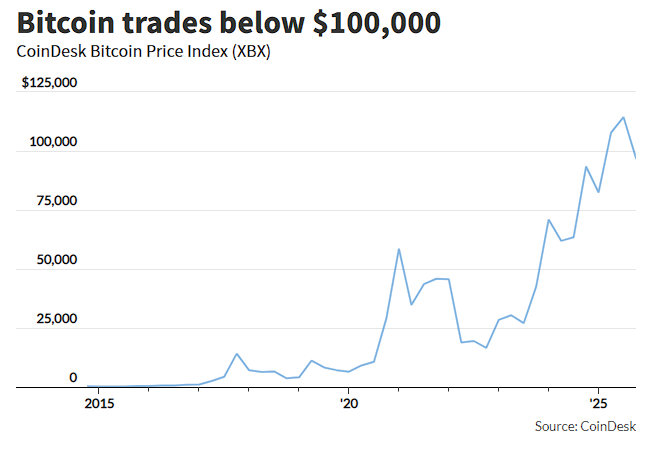
This marks Bitcoin’s third consecutive week of declines and its fifth weekly drop in the past six weeks. Even more alarming, the shockwaves from the flash crash on October 10 show no signs of abating—the total market capitalization of all cryptocurrencies has shed over $1 trillion.
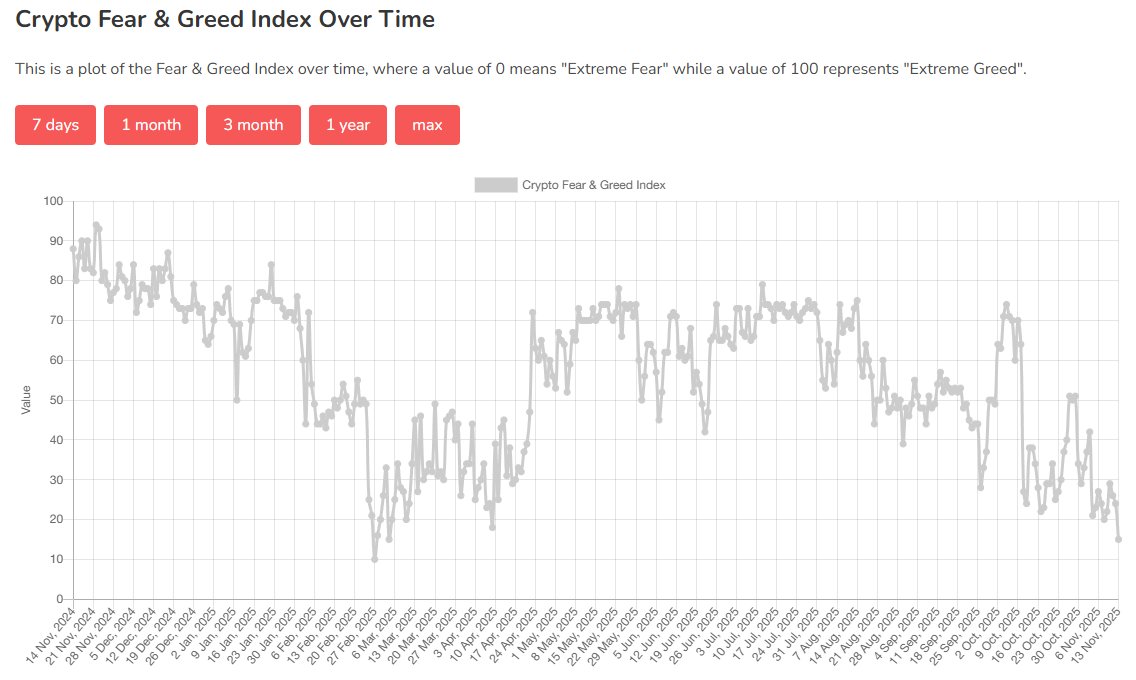
This divergence highlights Bitcoin’s unusual predicament: while maintaining a high correlation of 0.8 with the Nasdaq 100, Bitcoin exhibits an asymmetric pattern of "falling harder and rising weaker." More notably, according to a Wall Street Insights article, the Crypto Fear & Greed Index has plunged to 15, its lowest level since February of this year. The last time this index fell below 20, Bitcoin plummeted 25% within a month.
Meanwhile, multiple factors are weighing on Bitcoin. Long-term holders have sold approximately 815,000 Bitcoin over the past 30 days, the highest level since early 2024; dwindling market liquidity has led to five consecutive weeks of net outflows from Bitcoin ETFs. Even the Trump family’s crypto-related wealth has not been spared, with their holdings of World Liberty Financial tokens and American Bitcoin stocks both down about 30% from their peaks.
Tech Stocks Stage a Comeback, Bitcoin Plummets Against the Trend
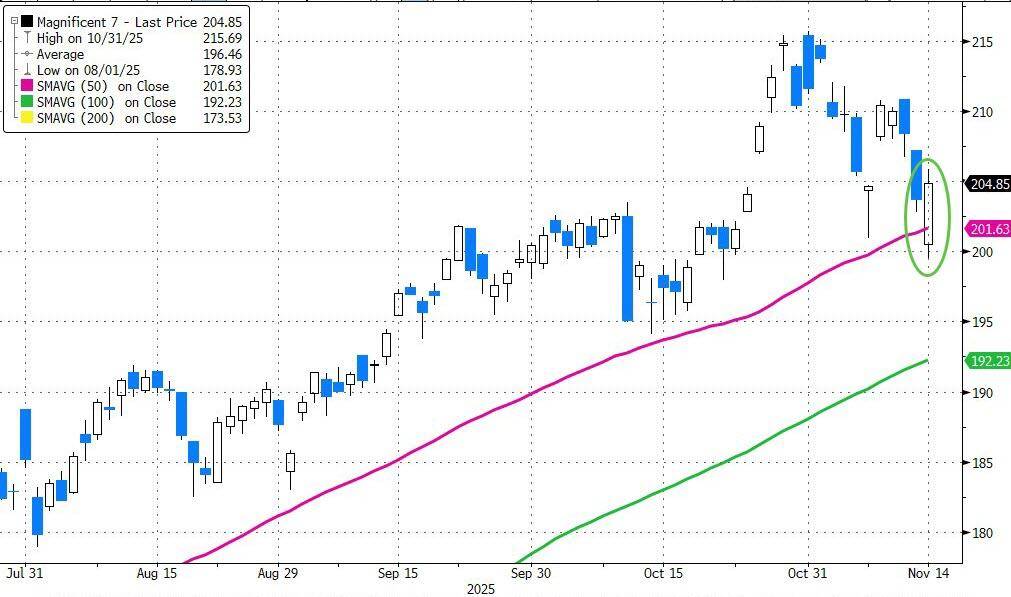
Friday’s market action was a tale of two extremes. The Nasdaq 100 and S&P 500 rebounded sharply after hitting their 50-day moving average support levels, while small-cap stocks found support at the 100-day moving average. According to Goldman Sachs trader Scott Rubner, market sentiment underwent a dramatic shift from "absolute panic" (4 a.m. to 9:30 a.m.) to "strong recovery" (10 a.m. to 11 a.m.).
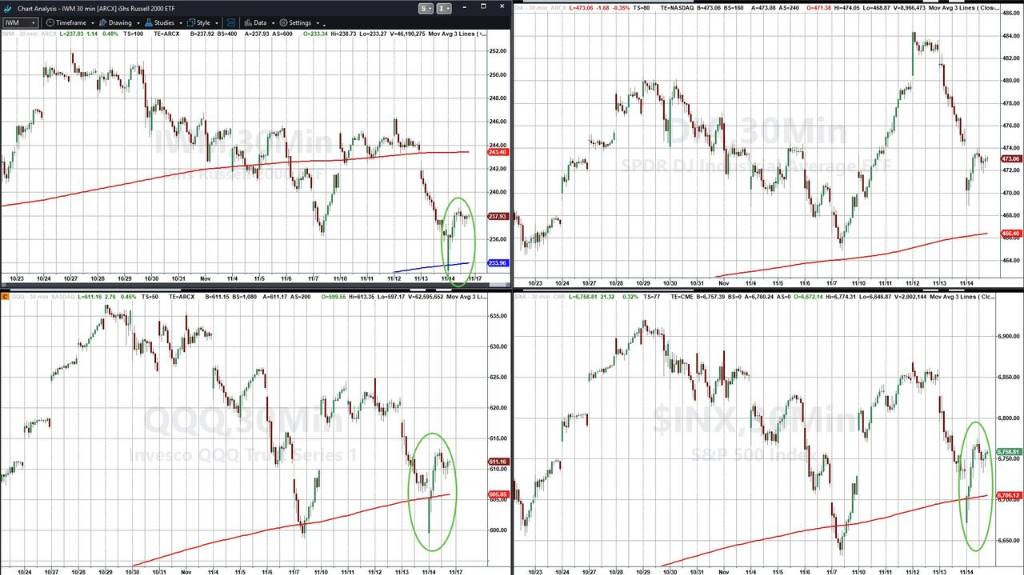
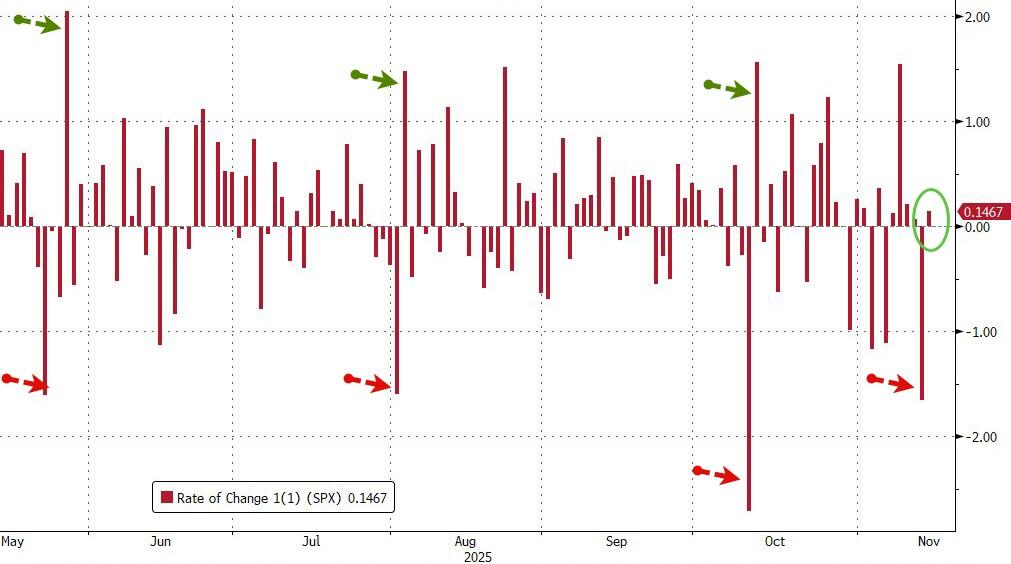
This V-shaped reversal was no coincidence. Goldman Sachs data shows that in 2025, the S&P 500 has averaged a 1.1% rebound the day after a decline of at least 1.5%.
ETF trading activity was the main driver of the morning bargain-hunting, accounting for 37% of the day’s trading volume—well above the year-to-date average of 27%. The Mag7 index, representing tech giants, staged a strong rebound after hitting the 50-day moving average, ending the week flat, with hedge fund covering demand at the 96th percentile.
However, Bitcoin was completely absent from this rebound. On Friday, Bitcoin fell 5%, hitting a low of $94,519—its lowest level since May 6. For the week, it declined 9.14%, marking its worst weekly performance since the week of February 28. Since hitting an all-time high of $126,272 on October 5, Bitcoin has fallen approximately 25%.
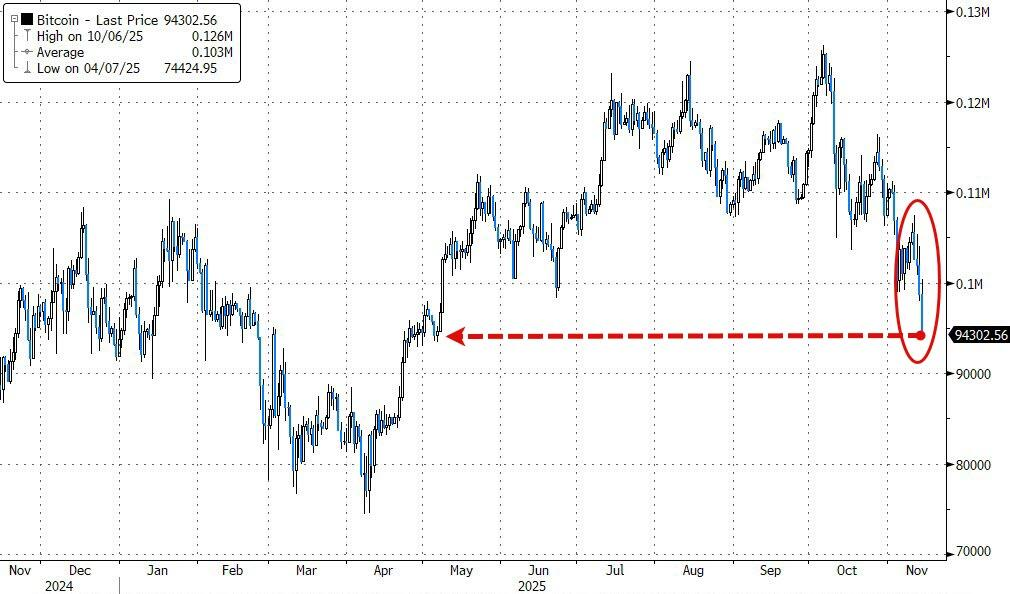
This divergence is particularly striking against the backdrop of improving market liquidity. Goldman Sachs traders noted:
Hedge funds are buying across the board, with demand at the 96th percentile; high-beta momentum stocks, heavily shorted stocks, and AI leaders all rebounded from a 3% opening decline to a 3% closing gain. However, Bitcoin continues to face pressure, indicating it is grappling with challenges distinct from traditional risk assets.
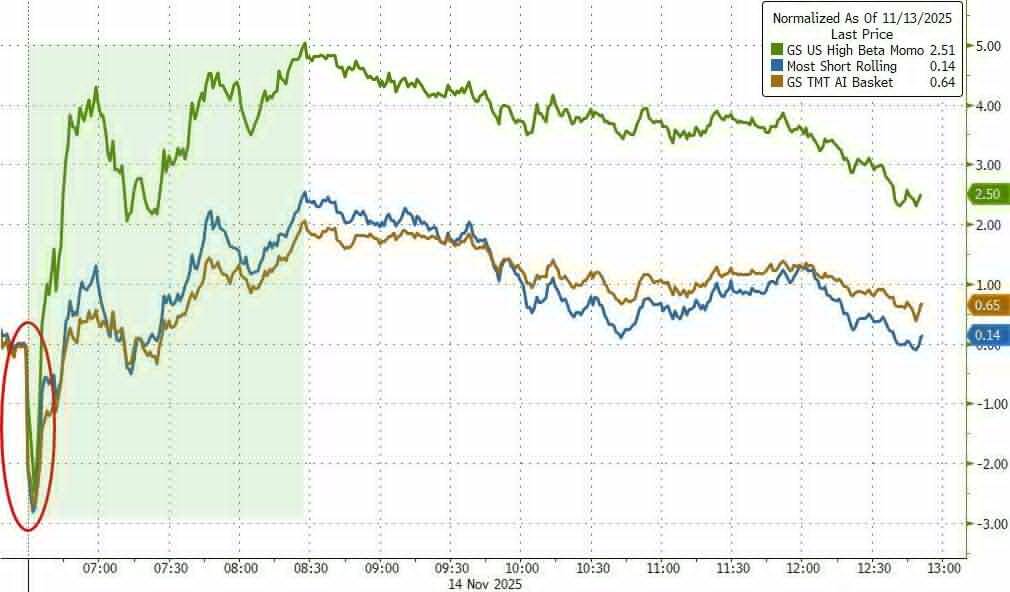
A Distorted Correlation: "Falling Harder, Rising Weaker"
Bitcoin’s correlation with the Nasdaq 100 remains high at around 0.8, but this relationship has taken on a distorted form—Bitcoin only moves in sync with stocks during declines, while showing sluggish responses during rallies.
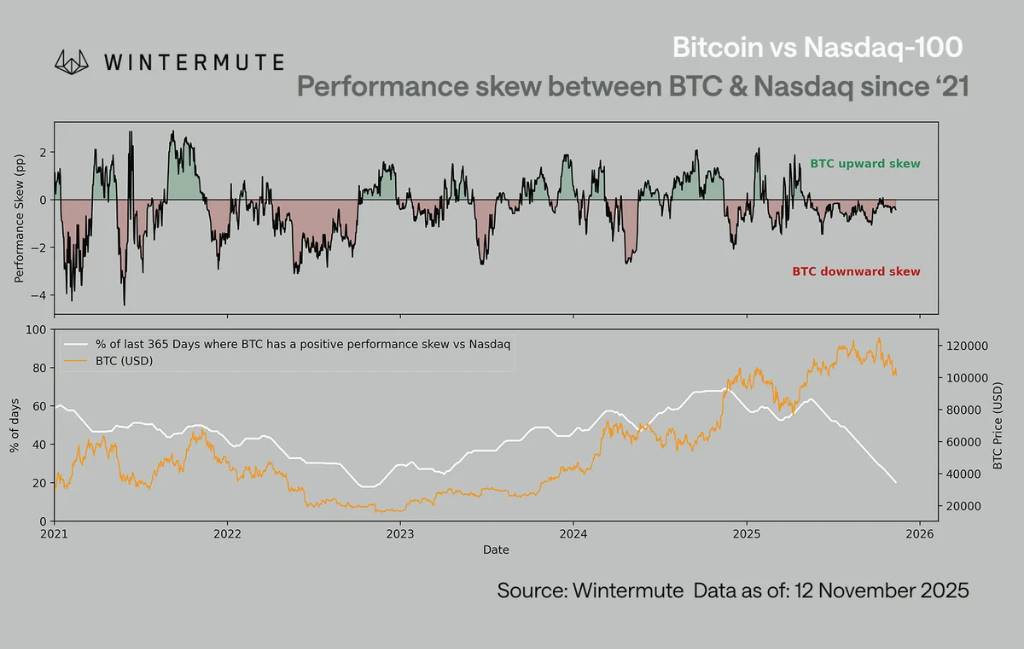
Data shows that Bitcoin’s performance skew relative to the Nasdaq has been significantly negative this year:
When the Nasdaq rises, Bitcoin’s gains are noticeably smaller; when the Nasdaq falls, Bitcoin falls even harder. This is not a breakdown in correlation but an expression of asymmetry—Bitcoin absorbs downside risk but fails to share in the upside.
More notably, this negative skew has reached its highest level on a 365-day rolling basis since the bear market of late 2022—a period when Bitcoin was one year past its previous cycle peak.
Historical experience suggests that negative asymmetry of this magnitude typically occurs during periods of extreme market weakness and near-bottom prices, not during market peaks. What is the logic behind this anomaly?
A shift in market attention is a key factor. In 2025, narrative capital that once flowed into the cryptocurrency space—new token launches, infrastructure upgrades, retail participation—has shifted to the stock market.
Large-cap tech stocks have become a magnet for institutions and retail investors seeking high-beta growth. Compared to the frenzy of 2020-2021, the marginal increase in risk appetite is now flowing more into the Nasdaq than into digital assets.
This means Bitcoin retains its high-beta characteristics during macro risk asset declines but has lost its narrative premium during rallies. It is reacting merely as the "high-beta tail" of macro risk, rather than as an independent investment theme.
Changes in liquidity structure have exacerbated this asymmetry. Stablecoin issuance has peaked, ETF inflows have slowed, and exchange market depth has not recovered to early 2024 levels.
This fragility amplifies Bitcoin’s negative reaction during stock market pullbacks, resulting in consistently higher downside participation than upside participation.
Crypto Fear & Greed Index Plunges to Yearly Low
Market sentiment indicators are confirming this extremely pessimistic atmosphere. According to a Wall Street Insights article, on November 13, the Crypto Fear & Greed Index plummeted to 15, its lowest level since February of this year.
This "extreme fear" reading is alarming—the last time the index fell below 20 was on February 27, after which Bitcoin fell 25% to $75,000 within a month.
A report from market sentiment analysis platform Santiment shows a sharp increase in negative discussions around Bitcoin, Ethereum, and XRP, with the positive/negative sentiment ratio declining significantly and sentiment levels well below normal.
This indicates that negative discussions are dominating market narratives, with investor confidence remaining persistently low.
Since the large-scale liquidation event on October 11, key sentiment indicators show that market sentiment has not only failed to recover but has worsened further.
Although Santiment interprets such extreme negative sentiment as a potentially bullish signal indicating a local bottom, current price action clearly shows no definitive signs of a reversal.
Whale Selling Intensifies, Long-Term Holders Dump Holdings
As Bitcoin remains "unable to recover," multiple factors are collectively weighing on the cryptocurrency.
Reports indicate that behind Bitcoin’s fall below the key $100,000 milestone, selling by "whales" (holders of 1,000 Bitcoin or more) and long-term holders has been a significant driver.
Blockchain data shows that over the past 30 days, long-term Bitcoin holders have sold approximately 815,000 Bitcoin, the highest level of selling activity since early 2024. More critically, whale wallets holding Bitcoin for over seven years have been selling at a rate exceeding 1,000 Bitcoin per hour.
This selling exhibits a "sustained, staggered distribution" pattern rather than a sudden, coordinated sell-off. Analysis suggests that many early holders view $100,000 as a psychological threshold—a level they have long discussed as a profit-taking point. Since Bitcoin first broke $100,000 in December 2024, selling by long-term holders has accelerated.
Cory Klippsten, a Bitcoin industry veteran and CEO of Swan Bitcoin, stated:
"Many of the early holders I’ve known since I entered this space in 2017 have been talking about the $100,000 figure. For some reason, this is the level people have always said they would sell at."
However, the real concern is not the selling itself but the diminishing ability of the market to absorb these sales. In late last year and early this year, when long-term holders sold Bitcoin, other buyers stepped in to support the price, but this dynamic appears to have changed.
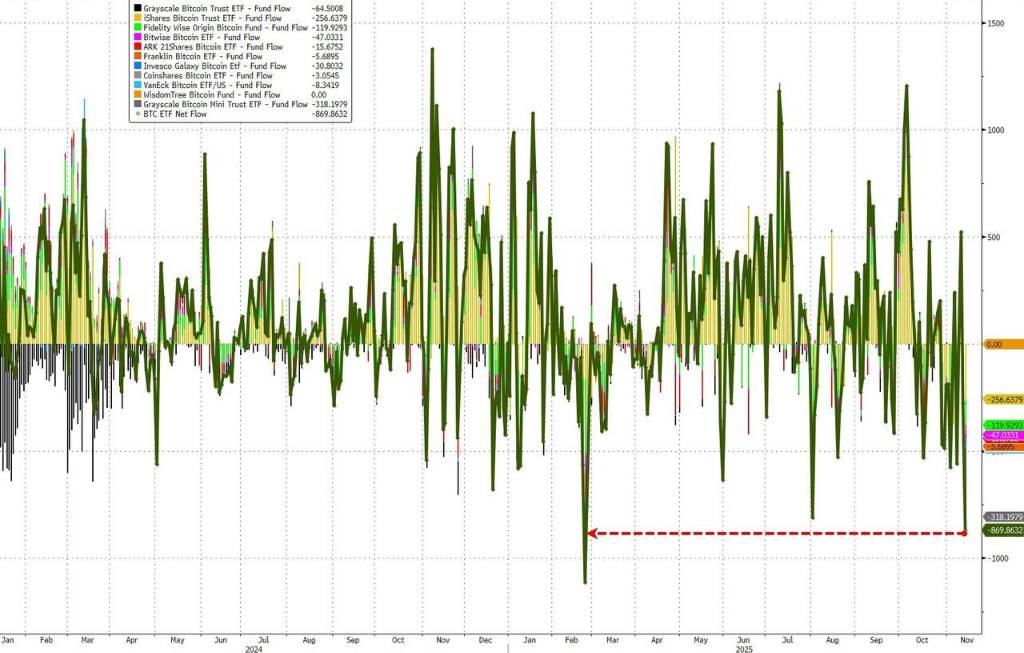
ETF flows confirm weak demand. As of Thursday, Bitcoin ETFs saw net outflows of $311.3 million this week, marking the fifth consecutive week of outflows—the longest streak since March 14. Over the past five weeks, cumulative outflows reached $2.6 billion, second only to the $3.3 billion outflow over the five weeks ending March 28.
Trump Family Wealth Also Takes a Hit
Amid the turmoil in the cryptocurrency market, the wealth President Trump’s family derived from cryptocurrencies has also shrunk.
In the month since Bitcoin hit its peak of $126,272 on October 5, stocks and tokens related to cryptocurrencies held by Trump and his family have all declined significantly.
The Trump family’s cryptocurrency investment portfolio includes Trump Media & Technology Group, as well as blockchain company World Liberty Financial and Bitcoin miner American Bitcoin. World Liberty Financial tokens, along with stocks