






By: Blockchain Knight
NFT trading activity showed signs of recovery in Q3 2025, breaking the prolonged downtrend of the post-hype era.
After two years of market contraction and narrative shifts, the on-chain market has found new footing, with growth now driven not by blue-chip collections or speculative art, but by lower-cost infrastructure, loyalty programs, and sports-related assets.
The core appeal of these assets lies in utility rather than status signaling.
NFT Trading Volume Rebounds, Sales Hit All-Time High
As Ethereum's scaling upgrades push activity toward L2s, Solana holds its ground with high throughput and compression tech, and Bitcoin inscriptions evolve into a collectible culture tied to fee market cycles, the NFT market's focus has shifted to low-cost infrastructure and utility-driven use cases.
Today, the key drivers of market growth are fee structures and distribution channels, not profile picture NFTs.
The Dencun upgrade reshaped the economic landscape: Ethereum's EIP-4844 proposal reduced data costs for rollups, slashing L2 transaction fees to pennies and enabling gas-free or sponsored minting for mainstream users.
Post-upgrade, L2 fees dropped over 90%, a change reflected in minting behavior and cementing Base as a core distribution channel.
In the Solana ecosystem, compression technology enables large-scale NFT issuance for loyalty programs and access-gated applications.
Deploying 10 million compressed NFTs costs roughly 7.7 SOL, with median transaction fees remaining near $0.003 even under high load.
Bitcoin inscriptions have carved a separate niche, their development closely linked to mempool cycles and miner revenue. By February 2025, over 80 million inscriptions had been created, ranking top three by historical NFT sales volume.
Demand-Side Recovery Masks Underlying Concerns
DappRadar data shows NFT trading volume nearly doubled quarter-over-quarter in Q3 2025 to $1.58 billion, with sales reaching 18.1 million—a new all-time high for quarterly transactions.
Sports NFTs stood out, surging 337% QoQ to $71.1 million in volume. The periodic utility, access rights, and loyalty benefits of these assets decouple consumption behavior from floor prices.
Summer markets saw a sharp rebound followed by cooling: CryptoSlam reported July 2025 sales hit $574 million (second-highest monthly total for the year), before declining roughly 25% in September amid broader crypto risk-off sentiment.
This trend confirms the market has entered a "lower average sale price" phase while demonstrating that total NFT volume remains correlated with overall crypto market fluctuations, even as unique users and utility-focused categories hold steady.
Distribution channels are increasingly pivotal. Wallets with embedded key functionality and gas sponsorship eliminate the friction that hindered user onboarding in previous cycles.
Coinbase's Smart Wallet offers key-based login and gas sponsorship in supported apps; Phantom reported 15 million monthly active users in January 2025, providing a user base for mobile and social minting channels.
In blockchain networks where cultural and social traffic reinforce each other, this distribution reach is critical—exemplified by Base.
This year, Base has surpassed Solana in certain NFT volume metrics, fueled by low-cost minting, Zora's batch minting cadence, and Farcaster-linked distribution.
This shift means creators now model distribution data before selecting launch platforms, then reverse-engineer fee strategies accordingly.
Royalties No Longer Central to Revenue Models
Following the 2022 market peak, creator royalty earnings plummeted as marketplace competition made royalties optional across most platforms.
Nansen data shows royalty revenue hit a two-year low in 2023 and has failed to recover to previous levels.
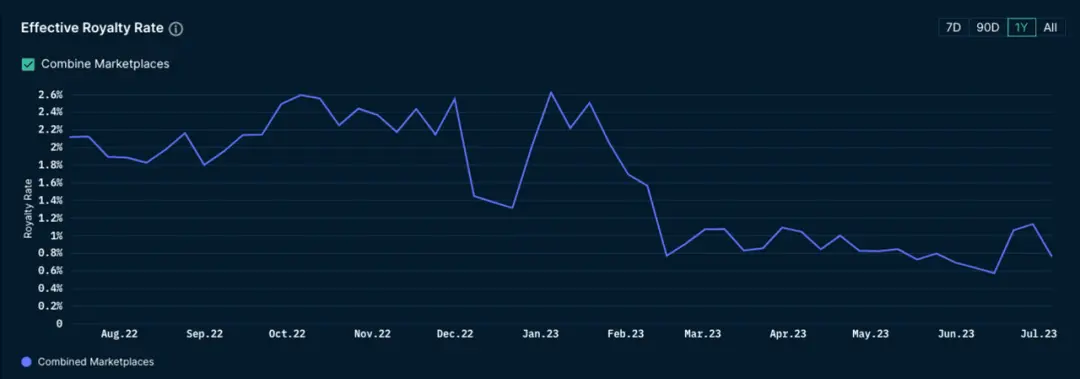
Countering this trend, platforms enforcing royalties are gaining traction. In late 2023, Magic Eden partnered with Yuga Labs to launch an Ethereum marketplace mandating creator royalties, creating a protected launch channel for established brands.
The market has bifurcated: open markets rely on low fees, primary sales, IP partnerships, and retail integrations for creator profits, while closed ecosystems use contractual enforcement for high-end NFT launches.
Where incentives dictate capital flows, marketplace shares remain in flux.
On Solana, Magic Eden and Tensor form a duopoly, with their market shares oscillating between 40-60% based on reward programs and UI adjustments.
This reflects incentive cycles rather than structural change—share charts may suggest shifts, but eventually revert to the mean.
For creators, the key takeaway is to negotiate distribution strategies during launch planning rather than defaulting to a single platform.
User Flows Reveal Near-Term Development Paths
Sports, ticketing, and loyalty programs achieve scale because their benefits are periodic and repeatable, with core on-chain functions embedded into existing ticketing and e-commerce flows.
DappRadar's Q3 2025 data shows sports NFT volume growth outpacing the overall market—and this excludes full-season or league-wide partnerships.
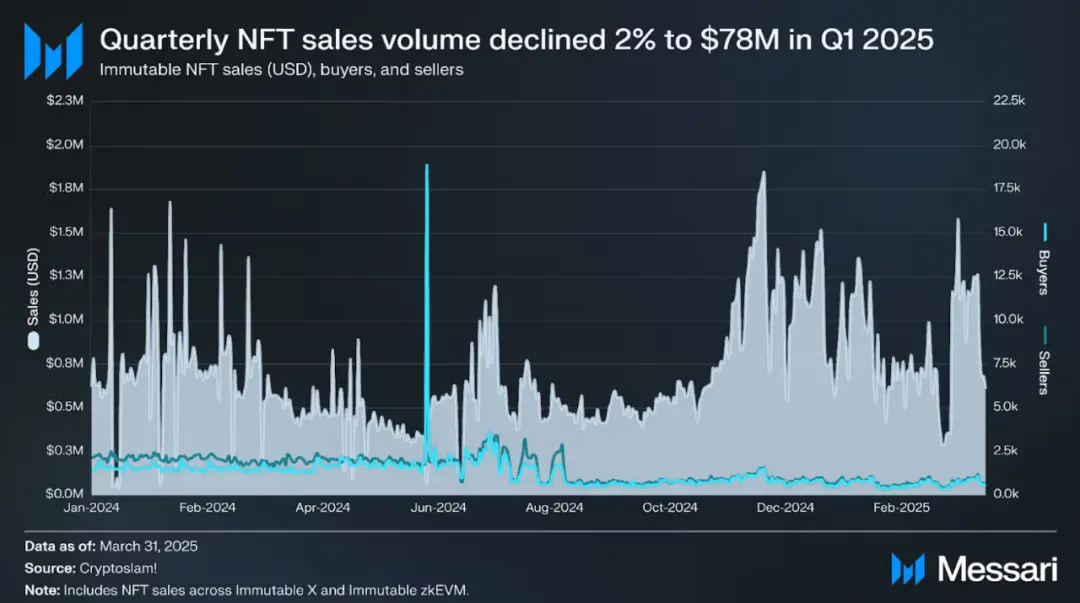
Gaming growth is more measured. Messari data shows sustained transaction growth on Immutable's zkEVM, whose "Ethereum-level security, L2 user experience" design aligns well with asset custody and ongoing secondary trading fee needs.
IP and licensing partnerships form another bridge from digital collectibles (JPEGs) to consumer channels. Pudgy Penguins now appear in over 3,000 Walmart stores, creating a path from NFTs to physical retail and licensing revenue.
For creators, blockchain costs and user experience are now clearly differentiated:
Ethereum L1 still dominates provenance and high-value art, with most platforms having volatile gas fees and optional royalties;
Post-Dencun, Ethereum L2s (like Base) offer sub-cent fees, sponsored/gasless transactions, and social distribution via Farcaster;
Solana's compression enables million-NFT deployments for dollar-scale costs, with mobile-first wallet ecosystems driving reach;
Bitcoin inscriptions focus on scarce collectibles, where rising fees are a feature, not a bug.
Macro Environment and Scenario Evolution
2025 annualized NFT trading volume is projected between $5-6.5 billion, with H1 average sale prices stabilizing at $80-100—establishing a baseline for next year's scenarios.
Using CryptoSlam's monthly sales data and DappRadar's category breakdowns:
Bear Case: If crypto markets stagnate and average sale prices decline, total NFT volume could drop to $4-5 billion, with fee-sensitive use cases concentrating on Solana and Ethereum L2s, Ethereum L1 art holding steady, and inscriptions fluctuating with Bitcoin fee cycles.
Base Case: If embedded wallets and social minting channels keep expanding, sports/live events scale cross-seasonally, and brands experiment with royalty-enforcing platforms, NFT volume could reach $6-9 billion.
Bull Case: If mobile distribution sees breakout growth (Base and passkey logins normalize minting, Phantom exceeds 20M MAU, ticketing pilots become mainstream, gaming assets sustain trading), NFT volume could hit $10-14 billion.
In all three scenarios, Ethereum L2s and Solana dominate market share, Ethereum L1 focuses on niches, and Bitcoin inscriptions remain a stable scarce collectibles segment.
Six Key Variables Dictate Growth Trajectory
1. Wallet UX & Distribution: Core metrics include passkey adoption, gas sponsorship usage, and MAU for Phantom and Coinbase Smart Wallet.
2. Royalty Enforcement Reach: Impacts high-end NFT launches, including OpenSea's policy stance and health of creator-friendly Ethereum platforms.
3. Sports & Ticketing Scale: Expansion from pilots to full-season deals turns one-time volume into recurring revenue.
4. Base & Zora Launch Cadence: Monthly mints, Base's share of NFT volume, and Farcaster Frames synergy indicate social distribution sustainability.
5. Solana Compression Adoption: Compressed NFT mint counts and per-million deployment costs signal whether loyalty/media apps move from pilot to production.
6. Bitcoin Fee Cycles: Inscriptions' and Runes' ties to mempool congestion will continue influencing collectible pricing.
Two risks persist. Wash trading and spam still distort GMV and sales figures, making average sale prices and organic-filtered dashboards safer metrics.
Marketplace incentives can create illusory "paradigm shifts" in share charts (driven by airdrop cycles), especially within Solana's duopoly.
Thus, creators should factor this volatility into launch planning from the outset.
Another operational constraint is revenue design: with royalties mostly optional in open markets, primary sales, IP licensing, and retail partnerships carry greater weight.
Meanwhile, royalty-enforcing closed platforms offer premium launch channels only accessible to select brands.
Industry Shift: From "Endgame" to "Migration"
The JPEG mania has ended. NFT infrastructure costs have plummeted, use cases are shifting to ticketing, sports, gaming, and IP, and wallet/distribution systems are integrating into users' existing contexts.
For investors who spent six figures on AWS-hosted JPEGs, blue-chip flagship Bored Ape Yacht Club remains precarious.
One ape that sold for over 74 ETH in 2021 is now worth just 9 ETH—an 87% drop in three years.
The speculative frenzy in non-fungible tokens may be over, but will the underlying technology gain recognition for real-world utility?
Time will tell, but current signs are promising—though that promise offers little solace to those who bought at the peak.
Q3 2025 closed with $1.58 billion in NFT volume and 18.1 million sales, as market structure continues evolving toward utility.